Product Updates

June 2026
Find out what's new in JUne 2026
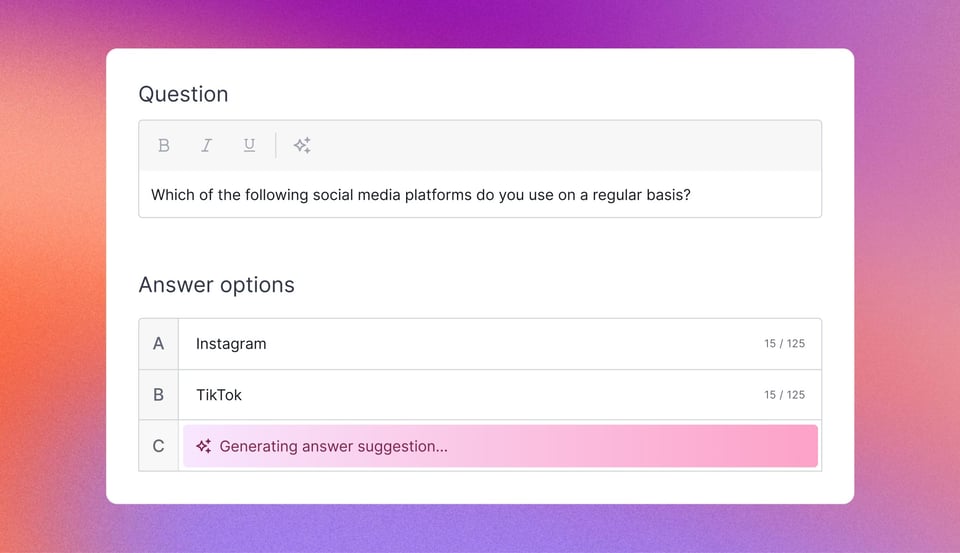
Test images with Appinio Conversations, and organize projects much more intuitively.
Read more

May 2026
Find out what's new in May 2026
Split your Mental Availability data to get every angle of the insight you might need, and work with fixed portfolios in the TURF simulator.
Read more

April 2026
Find out what's new in April 2026
Synthetic personas pave a faster way to your focus groups, and MaxDiff allows for more depth.
Read more

March 2026
Find out what's new in March 2026
Learn about how keystroke analysis keeps bots away and how you can personalize your boards with colors.
Read more

February 2026
Find out what's new in February 2026
See how AI can help you explore KANO and Gabor Granger results, and do more with filters in CSV exports.
Read more

January 2026
Find out what's new in January 2026
Explore your MaxDiff results with AI, save complex CSV configurations, and more.
Read more
November 2025
Find out what's new in November 2025
Explore brand tracking data more efficiently with enhancements of the Tracking dashboard: better filtering, improved table view, and Mental Availability KPIs.
Read more

October 2025
Find out what's new in October 2025
Build a questionnaire draft with just a drag and drop. The Platform UI is now much easier to the eyes with dark mode.
Read more
September 2025
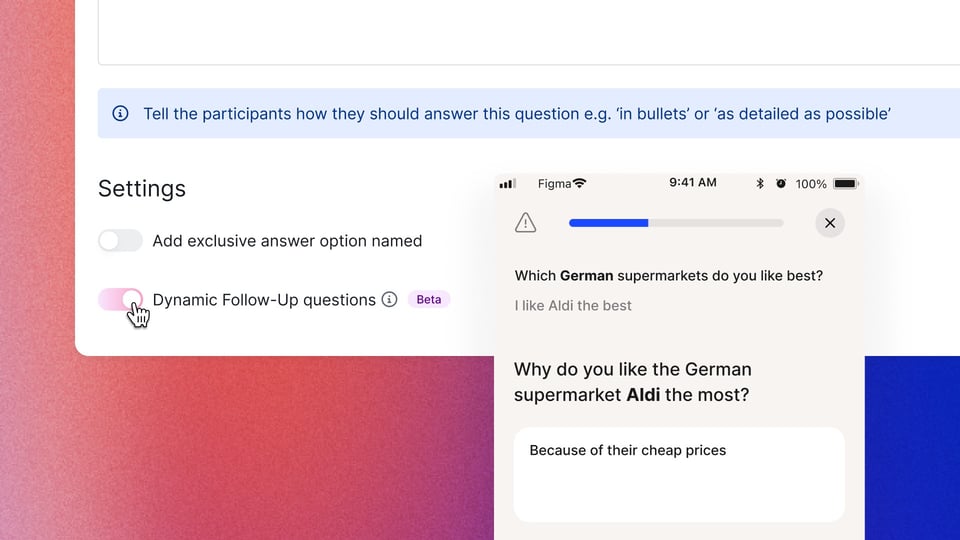
Find out what's new in September 2025
Follow-up questions for open-ended answers, setting up screen-outs, and more!
Read more
August 2025
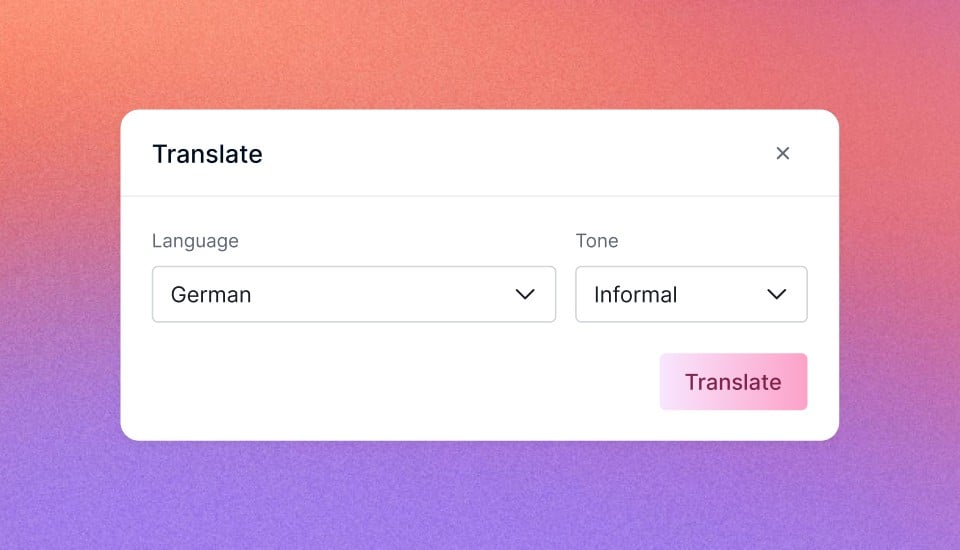
Find out what's new in August 2025
Automated translations of surveys, one-click survey imports, and more!
Read more
July 2025
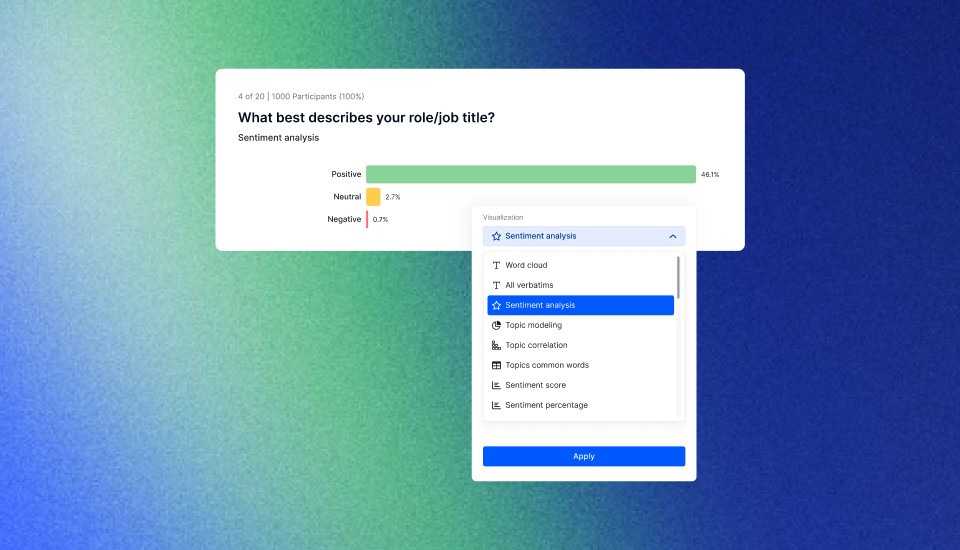
Find out what's new in July 2025
Sentiment Analysis for deeper insights, anchor links for easier navigation, and more!
Read more
June 2025
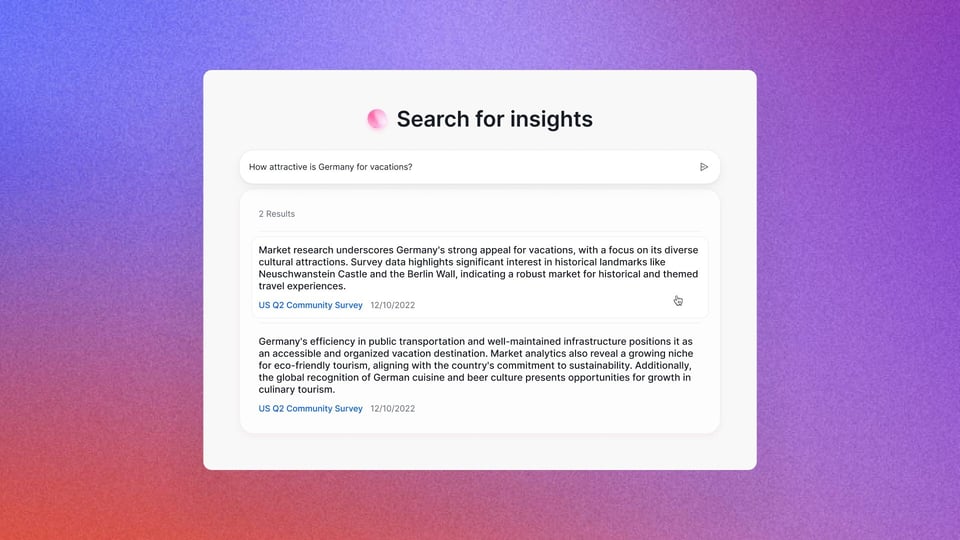
Find out what's new in June 2025
A new way of exploring your past research, AI insights in bulk, and non-significant P-values in the results.
Read more
May 2025
Find out what's new in May 2025
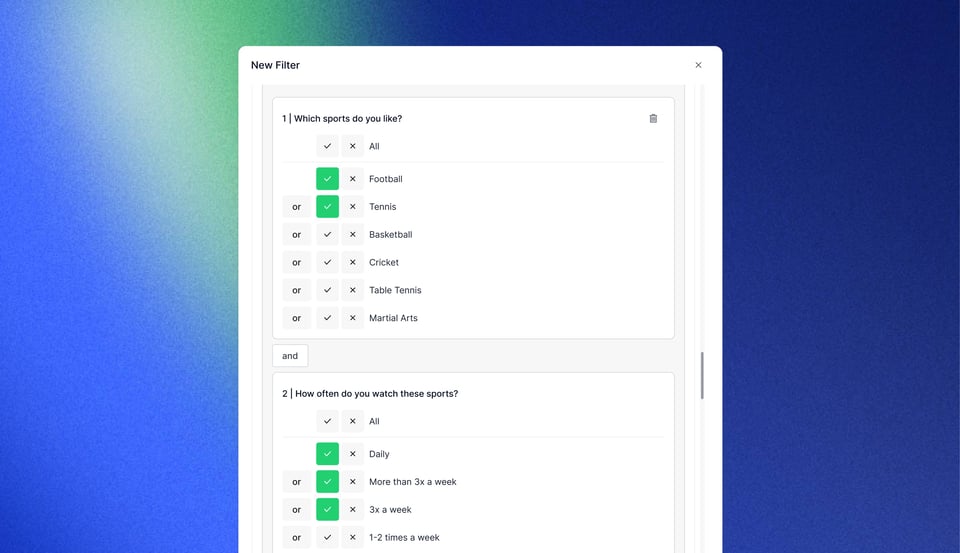
Better ways to program filters with AND/OR options, a simpler matrix setup, AI insights on Mental Availability, and much more to boost your workflow!
Read more
Past Updates
Looking for past updates?
Find them here
Read more