Press Team · 02.12.2025 · 6min read
We've got some exciting news to share with you today. Our beloved dashboard is getting a major upgrade: “Appinio Boards." We've reimagined and refined it to become THE destination where the world creates, collaborates, shares, and comments on the most beautiful market research reports and papers. So, meet “Appinio Boards”, and get ready to build your story and share it with the world!
Turn data into insights with intuitive dashboards
You know those moments when you stumble upon a visually stunning magazine and get lost in its pages? Well, that's exactly what our “Appinio Boards" allow you to do with your data. While it has always been possible to go through the data by splitting and filtering, we have introduced a revolutionary feature: the ability to create customized boards that display only the data you desire and allow the saving of splits, filters and visualization types. Not only can you save these boards for yourself, but you can also share them with others. This game-changing enhancement allows for a more focused and efficient data analysis experience.
Tell your story through data effectively
We know how crucial it is to get your research projects into the right hands and in the right format – but we’ve got your back. It's equipped with all the tools you need to keep your stakeholders in the loop about the latest insights. Additionally, should you find yourself needing to present different stories using the same data to cater to varying audience interests, you can effortlessly create multiple boards – each dedicated to a specific story and stakeholder. Whether you're a researcher, insights manager, marketer, or product owner, we've got you covered. So go ahead and spread the word about your research projects, knowing that success is just a few clicks away. Below are some of our highlighted features:
Feature 1: Choose questions and the order you want

As a survey owner, you should be able to add a question from the survey into any numbering position inside your report – and now you can do exactly that to have full control over your storyline. This new feature enables you to have more context and easily decide which questions to add. It also gives you the ability to bulk select questions and add them sequentially to your report.
Feature 2: Save different data splits and visualization types

Ever wondered "What do Gen Z think about this?" or "How do buyers vs. non-buyers behave?". Wonder no more. Appinio Boards are here to show you all the nitty gritty of your data. This feature will enable you
- to save splits so that you can compare specific sub-target groups throughout your project.
- to filter for different target groups only for specific questions and show different target groups all within one view.
Now your data tells the story you want it to, without any compromise.
Feature 3: Add cards to highlight key findings

Telling different stories through data shouldn't mean flipping through countless pages or creating multiple documents with multiple exports.
With this feature, you can:
- add text cards to provide context, highlight key findings, or include links for additional insights,
- add your preferred media in PNG or JPEG format, whether it's an image or a snapshot from your latest sales report.
It's like having a versatile canvas for your data stories.
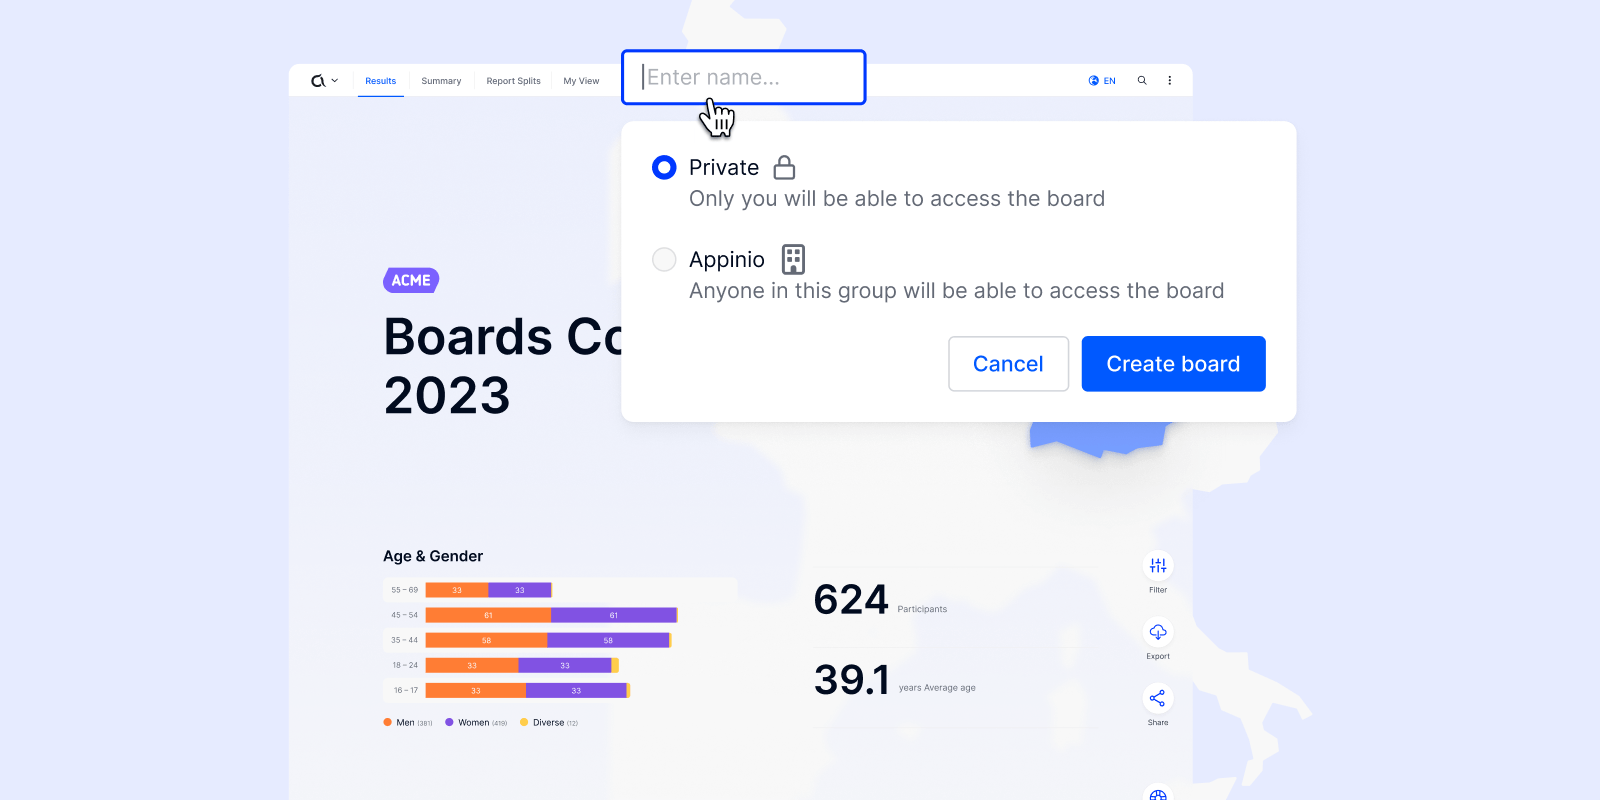
Feature 4: Save for yourself or collaborate with others
With “Appinio Boards" you can create multiple Boards, shared or private, for different views of your data.
And you can generate a public link for a single Board. Keep stakeholders informed with precisely the information they need, ensuring clarity and focused communication.
Feature 5: Add your logo to your Board
Want to showcase your brand front and center? Now you can! Upload your company logo in your profile, and watch it proudly displayed on your Dashboard and Boards. It's time to own your results with a touch of your unique brand identity.
Use different boards for different stories (e.g. demographic filters per board)
We understand that each team member may have their own specific data needs. That's why we’ve built Boards to enable users and teams to create multiple Boards within one project. You can easily navigate between tabs, ensuring that everyone gets to see the data that matters most to them. Whether it's nationally representative data or a specific target group, our “Boards” have got you covered.
Wrapping up this epic announcement
So there you have it, folks! The “Appinio Boards" are here to revolutionize the way you create and share market research reports. With its intuitive interface, powerful features, and the ability to build magazine-like stories with your data, your reports will never be the same again. Don't just take our word for it, give it a try and see the magic for yourself. Start building your story and share it with the world. Cheers to the power of data storytelling!