Appinio Research · 10.01.2025 · 27min read

Ever wondered how we capture a single moment in a constantly changing world? What if you could freeze time to understand a population's characteristics or behaviors at that precise instant?
In this guide, we explore the intriguing realm of cross-sectional studies, unveiling their power to provide a snapshot of the present. Whether you're a curious novice or a seasoned researcher seeking to grasp the intricacies of this methodology, join us in unraveling the secrets of cross-sectional studies.
What is a Cross-Sectional Study?
A cross-sectional study is a research method that involves collecting data from a population at a single point in time. It aims to provide a snapshot of the population's characteristics, behaviors, or conditions, allowing researchers to explore associations and trends.
The primary purpose of a cross-sectional study is to examine the prevalence of specific traits or conditions within a population. Researchers use this method to gather data efficiently and quickly, making it a valuable tool for assessing health, attitudes, behaviors, or characteristics.
Cross-sectional studies are often used to generate hypotheses, identify trends, and inform public health policies and interventions.
Key Features and Characteristics
Cross-sectional studies possess several key features and characteristics that distinguish them from other research designs:
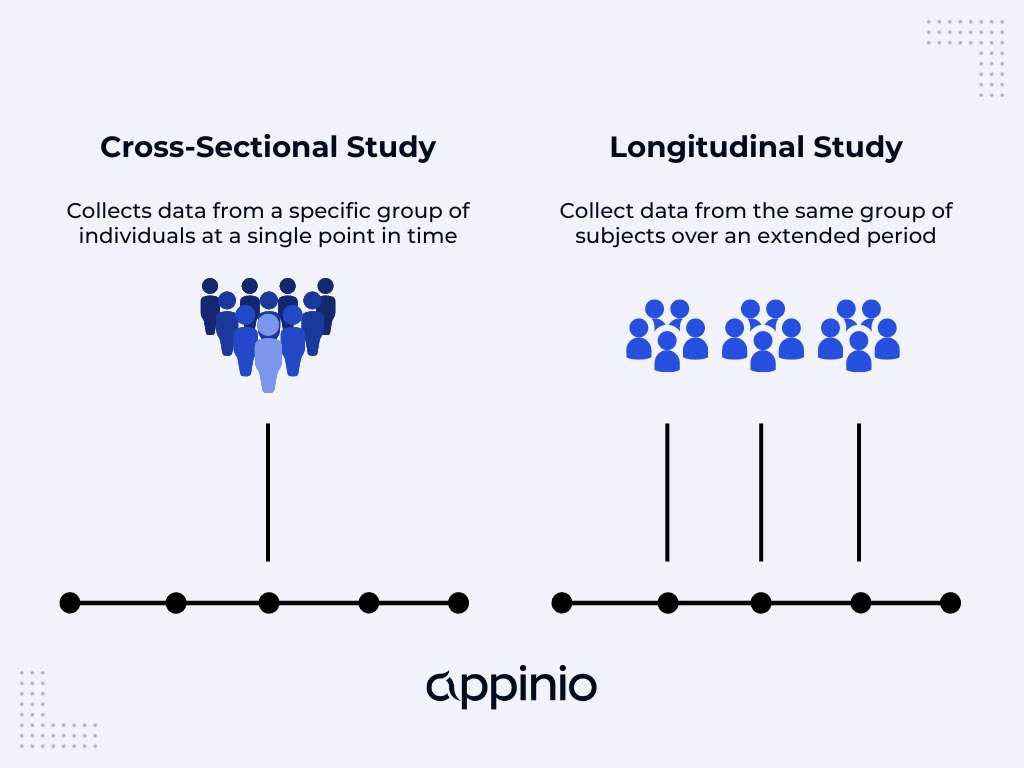
- Snapshot in Time: Unlike longitudinal studies that follow participants over time, cross-sectional studies collect data at a single point in time. This snapshot approach provides insights into the population's status at that moment.
- Observational Nature: Cross-sectional studies are typically observational, meaning researchers do not intervene or manipulate variables. Instead, they observe and collect data from participants as they naturally exist.
- Prevalence Assessment: These studies focus on determining the prevalence of specific conditions, behaviors, or characteristics within the population. For example, a cross-sectional study might assess the prevalence of smoking among adults in a particular region.
- Efficiency: Cross-sectional studies are known for their efficiency. They are quicker to conduct and often more cost-effective than longitudinal studies, which require long-term follow-up.
Importance in Research
Cross-sectional studies hold significant importance in various fields of research:
- Health and Medicine: In the healthcare sector, cross-sectional studies help assess disease prevalence, identify risk factors, and understand the distribution of health conditions within specific populations. They aid in shaping public health strategies and healthcare policies.
- Social Sciences: Cross-sectional studies are essential for exploring societal trends, attitudes, and behaviors. Researchers use them to study social phenomena, understand cultural differences, and monitor shifts in public opinion.
- Epidemiology: In epidemiology, these studies play a critical role in investigating disease outbreaks, monitoring the spread of diseases, and identifying patterns of infection within communities.
- Market Research: Businesses and marketers use cross-sectional studies to analyze consumer preferences, purchasing behavior, and market trends. These insights guide product development, marketing strategies, and market expansion.
- Education: Educational researchers employ cross-sectional studies to assess the academic achievement of students, explore factors influencing educational outcomes, and identify areas for improvement in educational systems.
In essence, cross-sectional studies provide a valuable snapshot of the world at a specific point in time, offering insights that inform decision-making, drive research agendas, and contribute to our understanding of various aspects of society and human behavior.
Advantages of Cross-Sectional Studies
Cross-sectional studies offer several notable advantages that make them a valuable research method in various fields. Let's explore these advantages:
- Quick and Cost-Effective: Cross-sectional studies are known for their efficiency. They can be conducted relatively quickly compared to longitudinal studies that require tracking participants over an extended period. This speed translates into cost-effectiveness, making them a suitable choice for researchers with limited resources and tight timelines.
- Snapshot of Population Health: One of the primary strengths of cross-sectional studies is their ability to provide a snapshot of a population's health, behaviors, or characteristics at a specific moment. This instantaneous view is invaluable for assessing the current state of affairs, such as disease prevalence or public opinion, which can guide decision-making and policy development.
- Suitable for Prevalence Studies: Cross-sectional studies excel at estimating the prevalence of specific conditions, behaviors, or attributes within a population. They allow researchers to gauge the extent of a problem or phenomenon, such as the prevalence of smoking among teenagers or the incidence of a particular disease within a region. This prevalence data is critical for public health planning and intervention strategies.
- Exploration of Multiple Factors: Cross-sectional studies enable researchers to explore the relationships between multiple variables simultaneously. By collecting data on various factors within the same population, researchers can analyze how these factors may be associated or correlated. For example, you can study how age, gender, and income levels relate to obesity rates within a given community.
- Breadth of Applications: The versatility of cross-sectional studies makes them applicable across diverse fields. They are commonly used in health and medicine to assess disease prevalence and risk factors, in social sciences to understand societal trends and attitudes, in epidemiology to investigate disease outbreaks and patterns, and in market research to analyze consumer preferences and behaviors.
- Hypothesis Generation: Cross-sectional studies often serve as a starting point for further research. They can generate hypotheses or research questions based on observed associations. For instance, if your cross-sectional study reveals a correlation between physical activity and mental health, this can prompt more in-depth investigations into causation through longitudinal or experimental studies.
Limitations of Cross-Sectional Studies
While cross-sectional studies offer valuable insights, they also come with inherent limitations that researchers must consider:
- Cannot Establish Causation: Perhaps the most significant limitation of cross-sectional studies is their inability to establish cause-and-effect relationships. Since data is collected at a single point in time, it's challenging to determine whether a particular factor caused an outcome or if confounding variables are at play. For example, a cross-sectional study might find an association between coffee consumption and heart disease, but it cannot confirm whether coffee causes heart disease or if other lifestyle factors are involved.
- Temporal Ambiguity: Cross-sectional studies lack a temporal dimension. They do not provide information about the sequence of events. For instance, if you find an association between alcohol consumption and depression in a cross-sectional study, you cannot determine whether alcohol use led to depression or if individuals with depression are more likely to consume alcohol.
- Selection Bias: Cross-sectional studies are susceptible to selection bias. Participants may self-select into the study, and this self-selection can introduce bias if those who choose to participate differ systematically from those who do not. For example, in a health survey, individuals with certain health conditions may be more motivated to participate, leading to overrepresentation of specific health issues in the sample.
- Recall Bias: Data collected through self-report methods, such as surveys or questionnaires, can be prone to recall bias. Participants may not accurately remember or report past events, behaviors, or experiences. This can affect the accuracy of the data and compromise the study's validity.
- Limited for Rare Events: Cross-sectional studies may not be suitable for studying rare events or conditions. Since they rely on the prevalence of outcomes within a single timeframe, rare events may have too low an occurrence to provide meaningful insights.
- Potential Confounding Variables: Cross-sectional studies often identify associations between variables, but these associations can be influenced by confounding variables. These factors are related to both the exposure and the outcome but are not part of the study. Researchers must carefully consider and control for confounding variables to draw accurate conclusions.
Despite these limitations, cross-sectional studies remain a valuable tool in research. By understanding their strengths and weaknesses, researchers can make informed decisions about when and how to use this method and, when appropriate, complement their findings with other study designs to establish causation and temporal relationships.
How to Design a Cross-Sectional Study?
When embarking on a cross-sectional study, meticulous planning is vital to ensure the validity and reliability of your research. Let's delve deeper into the crucial aspects of designing and planning a cross-sectional study.
1. Study Population Selection
Selecting the right study population is the foundation of your research. It determines the scope and generalizability of your findings. To make informed choices:
- Define Your Target Population: Begin by clearly defining the group you intend to study. This definition should align with your research objectives. For example, if you're exploring the prevalence of diabetes, specify whether you're interested in adults aged 18-65, residents of a particular region, or a broader demographic.
- Sampling Frame: Once you have your target population, create a sampling frame listing all eligible individuals or units within that population. This frame ensures that every member of your target population has a chance to be included in your study.
2. Sampling Techniques
Choosing the proper sampling technique is pivotal in obtaining a representative sample that accurately reflects the characteristics of your target population. Here are some common sampling techniques:
- Random Sampling: This technique involves selecting participants entirely by chance. It ensures that every member of the population has an equal probability of being included in the sample. Random sampling minimizes bias and is often considered the gold standard.
- Stratified Sampling: In cases where your population can be divided into distinct subgroups (strata) with varying characteristics, stratified sampling is useful. You select a random sample from each stratum, ensuring a proportional representation of each subgroup in your final sample.
- Convenience Sampling: While not as rigorous as random or stratified sampling, convenience sampling can be practical in some situations. It involves selecting participants who are readily available or accessible. However, be cautious, as this method can introduce selection bias.
- Snowball Sampling: This technique is often used when studying hard-to-reach populations, such as drug users or undocumented immigrants. You start with a few initial participants and ask them to refer others, creating a snowball effect. It's useful when a formal sampling frame is challenging to establish.
3. Data Collection Methods
Once you have your sample, you'll need effective data collection methods. The choice of methods depends on your research objectives and the nature of the data you want to collect. Some standard data collection methods include:
- Surveys and Questionnaires: These structured instruments allow you to collect data from a large number of participants efficiently. They are helpful in gathering information on attitudes, behaviors, and opinions. Ensure that your questions are clear, concise, and unbiased.
- Interviews: Conducting interviews, whether in person, over the phone, or via video, enables you to gather in-depth qualitative data. It's particularly valuable when exploring complex topics or probing for detailed information.
- Observations: Observational studies involve watching and recording behaviors or phenomena as they naturally occur. This method is commonly used in fields like psychology, anthropology, and ecology. Ensure that your observations are systematic and consistent.
- Secondary Data Analysis: Sometimes, existing data sources can provide valuable insights for your study. These sources might include government reports, public datasets, or previous research findings. When using secondary data, verify its relevance and accuracy.
In today's fast-paced research landscape, efficiency and accuracy are paramount. That's where innovative tools like Appinio come into play, revolutionizing data collection processes. By harnessing the power of real-time consumer insights, Appinio empowers researchers to make informed decisions swiftly. Seamlessly integrate surveys, analyze responses, and gain valuable perspectives from diverse demographics with ease.
Elevate your cross-sectional study with Appinio's intuitive platform, driving impactful results and unlocking new avenues of exploration. Ready to experience the future of data collection? Book a demo today and embark on a journey of discovery!
4. Ethical Considerations
Ethical considerations are paramount when conducting research involving human subjects. Protecting the rights, privacy, and well-being of your participants is essential. Here are some fundamental ethical principles to keep in mind:
- Informed Consent: Participants must provide informed and voluntary consent to participate in your study. Clearly communicate the purpose, procedures, and potential risks involved. Ensure they understand their right to withdraw at any time without consequences.
- Confidentiality: Safeguard the confidentiality of participants' personal information. Use coding or anonymization methods to protect their identities. Only share data with authorized personnel.
- Ethics Review: If your research involves human subjects, seek ethical approval from an institutional review board (IRB) or ethics committee. This process ensures that your study complies with ethical standards and guidelines.
- Minimizing Harm: Take measures to mitigate any potential harm or discomfort to participants. This includes addressing psychological distress, physical risks, or breaches of confidentiality.
- Beneficence: Strive to maximize the benefits of your research while minimizing harm. Ensure your study has societal or scientific value and the potential benefits outweigh any risks.
By carefully considering these elements in the design and planning phase, you set a strong foundation for a successful cross-sectional study. Thoughtful decisions regarding your study population, sampling techniques, data collection methods, and ethical considerations will ultimately determine the quality and impact of your research.
Data Analysis in Cross-Sectional Studies
Analyzing the data collected in cross-sectional studies is a critical step in deriving meaningful insights. Let's explore the various facets of data analysis in cross-sectional studies.
1. Descriptive Statistics
Descriptive statistics provide an overview of your data, summarizing its key characteristics. These statistics help you understand the central tendencies, spread, and distribution of your variables.
Common descriptive statistics include:
- Mean: This is the average value of a variable and is calculated by summing all values and dividing by the number of data points. It provides an indication of the typical value within your dataset.
- Median: The median is the middle value in a dataset when all values are sorted. It's less influenced by extreme values and provides a measure of central tendency.
- Mode: The mode is the most frequently occurring value in your data. It can be instrumental when dealing with categorical variables.
- Standard Deviation: This statistic measures the spread or dispersion of your data points around the mean. A larger standard deviation indicates greater variability.
- Frequency Distributions: Create frequency distributions or histograms to visualize the distribution of your data. These graphical representations provide insights into the shape and patterns within your dataset.
2. Prevalence Calculation
One of the primary goals of cross-sectional studies is to calculate the prevalence of specific conditions or attributes within a population. Prevalence is the proportion of individuals in your sample or population who exhibit a particular trait or condition during the study.
The formula for prevalence is:
Prevalence = (Number of Cases with Trait / Total Number in the Sample) * 100%
Calculating prevalence is essential for understanding the magnitude and significance of a particular issue within your target population. It can inform public health interventions and policy decisions.
3. Associations and Correlations
Cross-sectional studies are valuable for exploring associations and correlations between variables. Here's how you can investigate these relationships:
- Chi-Square Test: Use the chi-square test to assess associations between categorical variables. It helps determine whether there is a significant relationship between two or more categorical variables. For example, you could use this test to examine the association between smoking status and lung cancer.
- Correlation Coefficients: When dealing with continuous variables, correlation coefficients like Pearson's correlation coefficient or Spearman's rank correlation can quantify the strength and direction of relationships. A positive correlation indicates that as one variable increases, the other also tends to increase, while a negative correlation suggests the opposite.
4. Subgroup Analysis
Subgroup analysis allows you to explore variations within your data by dividing your sample into smaller subgroups based on specific characteristics. This can uncover important nuances and disparities. Here's how to approach subgroup analysis:
- Identify Relevant Subgroups: Determine which variables or characteristics are relevant for subgroup analysis. For instance, you might want to examine differences in disease prevalence between different age groups or genders.
- Compare Subgroups: Conduct statistical tests or descriptive analyses to compare the prevalence or associations within different subgroups. This helps you understand whether there are significant variations in your findings across subpopulations.
- Interpret Subgroup Differences: When interpreting subgroup differences, consider potential explanations for variations. Are these differences due to demographic factors, geographic location, or other variables? Be cautious not to overinterpret minor subgroup differences.
How to Report and Interpret Results?
Effectively reporting and interpreting your cross-sectional study results is crucial for making your findings accessible and actionable.
1. Present Findings
Presenting your findings clearly and effectively is essential for conveying your research to both scientific and non-scientific audiences.
- Visual Aids: Create clear and concise visual aids, such as tables, graphs, and charts, to illustrate your key findings. Visual representations can make complex data more accessible.
- Clarity and Simplicity: Use plain language to explain your results. Avoid jargon and complex statistical terminology. Ensure that your audience can easily grasp the main takeaways.
2. Discuss Implications
Discussing the implications of your findings is a critical step in the research process. Consider the following:
- Real-World Relevance: Explain how your results are relevant in real-world contexts. How might they inform policy decisions, clinical practice, or future research?
- Comparison to Existing Literature: Situate your findings within the context of existing literature. Are your results consistent with previous studies, or do they offer novel insights?
3. Strengths and Weaknesses
Acknowledge both the strengths and weaknesses of your cross-sectional study:
- Strengths: Highlight what your study did well. Did it effectively capture a snapshot of the population's characteristics or prevalence? Were the data collection methods robust and reliable?
- Weaknesses: Be transparent about the limitations of your study. Did it face challenges related to selection bias, recall bias, or the inability to establish causation? Acknowledging weaknesses demonstrates scientific rigor.
4. Future Directions
End your report by suggesting avenues for future research. What questions or areas of inquiry have emerged from your study? Are there aspects that require further exploration, perhaps through longitudinal studies or controlled experiments?
By diligently analyzing your data and effectively reporting and interpreting your results, you contribute to the body of knowledge in your field and facilitate evidence-based decision-making. Proper presentation and discussion of your findings ensure that your research has a meaningful impact on both academia and the broader community.
Cross-Sectional Studies Examples
Cross-sectional studies have been instrumental in investigating a wide range of topics across various fields. Here, we explore several real-life examples to demonstrate the versatility and significance of this research method.
1. Health: National Health and Nutrition Examination Survey (NHANES)
NHANES is a large-scale cross-sectional study conducted by the Centers for Disease Control and Prevention (CDC) in the United States. It aims to assess the health and nutritional status of the U.S. population. The study collects extensive data, including dietary habits, physical activity, blood pressure, cholesterol levels, and prevalence of chronic conditions. Researchers use NHANES data to monitor trends in health and identify risk factors for diseases like diabetes, heart disease, and obesity. The study's findings have informed public health policies and interventions.
2. Social Sciences: General Social Survey (GSS)
The General Social Survey is a prominent cross-sectional study in the field of social sciences. It's conducted by the National Opinion Research Center at the University of Chicago. The GSS gathers data on various aspects of American society, including attitudes, behaviors, and opinions on topics such as politics, religion, race relations, and family life. Researchers use this data to track social trends over time and explore how demographics, socioeconomic status, and cultural factors influence people's beliefs and behaviors.
3. Epidemiology: Framingham Heart Study
The Framingham Heart Study, initiated in 1948, is a landmark cross-sectional and longitudinal study focused on cardiovascular health. It has played a pivotal role in identifying risk factors for heart disease, such as high blood pressure, high cholesterol, smoking, and obesity. In addition to its longitudinal component, the Framingham Heart Study has conducted cross-sectional examinations of various generations of participants, providing valuable insights into the prevalence of cardiovascular risk factors within the community. The study has contributed significantly to developing preventive strategies and cardiovascular guidelines.
4. Market Research: Consumer Behavior Study
In market research, cross-sectional studies are frequently used to understand consumer behavior and preferences. For example, a retail company might conduct a cross-sectional study to assess customer satisfaction and purchasing patterns. By surveying a diverse sample of customers at a particular point in time, the company can gain insights into customer demographics, product preferences, and the effectiveness of marketing strategies. These findings can inform business decisions like product development, pricing, and advertising campaigns.
Unlock the latest insights shaping the fast-moving consumer goods (FMCG) landscape with the Appinio FMCG report. Delve into comprehensive analyses and trends that illuminate the behaviors and preferences driving consumer choices in today's market. From shifting purchasing patterns to emerging consumer attitudes, this report equips you with actionable intelligence to stay ahead of the curve.
Download your free copy now and gain a competitive edge in understanding consumer dynamics!
5. Education: National Assessment of Educational Progress (NAEP)
The NAEP is a cross-sectional study conducted in the United States to evaluate the academic achievement of students in various subjects, including mathematics, reading, and science. It assesses a nationally representative sample of students across different age groups, grade levels, and demographic backgrounds. By administering standardized tests and questionnaires, the NAEP provides valuable information on the state of education in the country. Policymakers and educators use the results to identify areas of improvement in the education system and make data-driven decisions to enhance student learning outcomes.
These real-life examples illustrate the wide-ranging applications of cross-sectional studies in diverse fields. Whether examining health trends, societal attitudes, disease risk factors, consumer behavior, or educational outcomes, cross-sectional studies offer valuable snapshots of populations at specific times. The findings from such studies not only enhance our understanding of the world but also drive informed decision-making, policy development, and improvements in various aspects of our lives.
How to Conduct a Successful Cross-Sectional Study?
Conducting a successful cross-sectional study requires careful planning, meticulous execution, and an understanding of potential challenges.
Here are some essential tips to guide you through the process:
- Define Clear Research Objectives: Begin by clearly defining your research objectives and questions. What specific information are you trying to gather? Ensure that your objectives align with the study's scope and purpose. Having well-defined goals will guide every aspect of your study, from selecting the study population to analyzing the data.
- Thoroughly Plan Your Study Protocol: Develop a detailed study protocol that outlines every aspect of your research. This includes the study population criteria, sampling method, data collection tools, and analysis plan. A comprehensive protocol helps maintain consistency throughout the study and minimizes the risk of bias.
- Consider Your Study Population Carefully: Selecting the right study population is pivotal. Ensure it represents the group you want to study and aligns with your research objectives. If your study population is too broad, consider stratification to analyze subgroups separately and gain more specific insights.
- Sampling Techniques Matter: Choosing the appropriate sampling technique is crucial for obtaining a representative sample. Random sampling is the gold standard for minimizing bias. If you must use convenience sampling due to practical constraints, acknowledge this limitation in your study and its potential impact on generalizability.
- Pilot-Test Your Data Collection Tools: Before embarking on the full study, pilot-test your data collection tools, such as surveys or questionnaires, on a small group similar to your target population. This helps identify any issues with question clarity, response options, or the overall flow of the survey. Make necessary adjustments based on feedback.
- Prioritize Data Quality: Ensure that your data collection process maintains high standards of quality and accuracy. Properly train your data collectors to minimize errors and inconsistencies. Implement data validation checks to catch any data entry mistakes.
- Ethical Considerations Are Non-Negotiable: Adhere to strict ethical standards when conducting research involving human subjects. Obtain informed consent from participants, ensure their privacy, and seek ethical approval if required. Transparently communicate the study's purpose and potential risks to participants.
- Sample Size Calculation Is Vital: Calculate an appropriate sample size to ensure your study has sufficient statistical power. An inadequate sample size may lead to unreliable results or make it challenging to detect significant associations. Consult a statistician or use sample size calculators relevant to your study design.
- Data Analysis Must Be Rigorous: When analyzing your data, use statistical methods suitable for your research questions. Descriptive statistics can provide an initial overview, while inferential statistics like chi-square tests or regression analysis can help examine associations or correlations. Ensure your analysis plan is pre-specified in your study protocol to minimize post-hoc decisions.
- Transparent Reporting Is Key: When reporting your study's findings, be transparent about your methods, results, and limitations. Use clear and concise language to make your findings accessible to a broad audience. Present your data visually through charts and tables to enhance understanding.
- Acknowledge Limitations: Every study has limitations. Acknowledge and discuss them in your report. Be honest about potential sources of bias, confounding variables, and areas where your study design may fall short. This transparency demonstrates scientific rigor.
- Plan for Future Research: In your conclusion, suggest avenues for future research based on your findings. Consider what questions remain unanswered and how further studies could build upon your work.
By following these tips, you'll enhance the quality and impact of your cross-sectional study. Thoughtful planning, ethical conduct, meticulous data collection, and rigorous analysis are vital in uncovering valuable insights and contributing to the body of knowledge in your field.
Conclusion for Cross-Sectional studies
Cross-sectional studies offer a snapshot of the world around us at a single point in time. They're versatile, quick, and cost-effective, making them valuable tools in fields from healthcare to social sciences. With proper planning, ethical considerations, and diligent data analysis, you can harness the power of cross-sectional studies to explore, understand, and contribute to the ever-evolving landscape of knowledge.
Remember that while cross-sectional studies have their strengths, they also have limitations. They can't establish causation, and careful consideration of potential biases is crucial. But armed with the knowledge and guidance provided in this comprehensive guide, you're well-prepared to embark on your own research endeavors, contribute to your field, and make a meaningful impact on the world.
How to Conduct a Cross-Sectional Study in Minutes?
Introducing Appinio, the real-time market research platform that transforms the way you conduct cross-sectional studies. With Appinio, you can dive into the world of consumer insights, making it exciting and intuitive.
Here's why you'll love using Appinio for your cross-sectional research:
- Lightning-Fast Insights: Get from questions to insights in minutes, empowering you to make data-driven decisions swiftly.
- No Research PhD Required: Our platform is designed to be user-friendly, so anyone can easily conduct cross-sectional studies without needing a research degree.
- Global Reach, Targeted Precision: Define your ideal target group using over 1200 characteristics and survey them in more than 90 countries, ensuring you reach the right audience for your cross-sectional research.

