Appinio Research · 10.01.2025 · 18min read

Whether it's about political sentiment, customer satisfaction, the Appinio Hype Train or a company employee survey, surveys are the most common way to find out public sentiment, opinions, beliefs and tendencies. And of course the more people you ask questions to, the closer you get to a representative result. But imagine interviewing all the people in the UK to find out who they would vote for in the next election, impossible!
This is where the need of a representative sample comes into play.
A representative sample focuses on a portion of the population and aims to reflect the views of the general public. But, especially in survey research, what variables do you need to take into account? How do you know how many survey respondents you require to ensure you survey a representative sample of the population? In this article, we’ll show you which key values you need in order to calculate the perfect sample for your study and how accurately your results represent the population.
Do you want to calculate the sample size for your study quickly and already have all the key values? Then use our online sample size calculator margin or error to determine the sample you need.
Sample size calculator
Use our calculator to quickly check the sample size for your study. Just enter your values and check the result. All metrics used in the calculator are explained in detail later in the article. If you have more questions, feel free to reach out to
our experts via the chat.
Definition: What is a sample?
A sample is a small portion or quantity intended to show what the whole is like.
There are several different methods of sampling that can be used, for example, you could choose to use a “random sample,” where respondents are chosen entirely by chance from the population at large, therefore every member of the population has an equal chance to be selected for your study.
A random sample is useful when doing exploratory market research or gathering new ideas, but it would not be useful if you wanted to know how many Brits are vegan, as your random sample could exclude some participants (e.g. not enough women) or include too many people from the same group (e.g. too many Millennials), therefore, you would not be able to extract insights that are applicable to your desired target group or the general population.
The reason why sample size is important
That's why, in survey research especially, a sample needs to meet specific criteria and contain all the different groups - such as women, men or different age groups - in the same proportions to the population you want to represent. In addition, the sample should be large enough not only to be representative, but also to make reliable statements. When choosing a sample it is important to test its reliability, if a sample is too small the information collected may be partial, on the other hand if the sample is too large it would be a waste of resources. The larger the group, the closer are results to the target market, the less chance factors, errors and false statements can distort the result. The results are considered representative of the whole itself, i.e. applicable to the general public, when they reflect the normal distribution in the population
If you want to get survey data that is as reliable as possible, you need to strive to make your survey representative. In market research, you need to collect data from the target group before launching a product on the market in order to offer a product that consumers will want to buy or use. However, you can't ask every potential buyer their opinion, it would simply be too time-consuming and not cost-effective. Moreover, it is impossible to determine exactly the size of the potential buyer group. Therefore, before sending your survey out to your respondents, you need to define a sample size that represents your target population as closely as possible, and in all its facets.
How large should a sample be?
The larger the sample size, the more accurate results are, right?
Generally, the larger the sample, the more representative it is, that is under the condition that we are surveying the right people; namely, we won't survey men when we want to represent pregnant women.
The results of a survey are considered representative when the outcomes of the survey accurately reflect the overall population which means that you can draw reliable conclusions about the general population as all characteristics of the target population are also present in your sample.
So a larger sample makes reaching representativeness easier, but on the other hand, the larger the sample size, the more expensive and time-consuming your survey will be. So, how can you balance costs and representativeness?
In order to do this, you must make trade-offs between the size of the sample and the margin of error, namely, you have to find a sample size that is large enough to achieve the desired level of precision and stay within an acceptable margin of error.
Let’s have a look at the margin of error metric and what margin of error is considered acceptable.
What is the margin of error?
The margin of error (or marginal error) is a statistic expressing the amount of random sampling error in the results of a survey. The larger the margin of error, the less confidence one should have that a poll result would precisely reflect the result of a census of the entire population.
The margin of error relates to the size of your sample and the difference between results from your survey data and those from population (normal) distribution, it tells you how close your results reflect the views from the overall population.
Let's make an example.
As you can guess by the word margin, the margin of error is a range of values around the sample mean.
For example, a survey of 1000 people of your targeted population gives you a 5% margin of error, meaning that 95% of the time the results are within 5% range of what they would be if you had asked every single person in your target population. Thus, if your survey data indicates that 40% of the total population approve or disapprove of something, the margin of error means that you can be 95% confident that the true figure falls between 35% and 45%.
The marginal error indicates how close the results of the sample are to reality. This can be calculated by taking into account the sample size, margin of error and confidence level. The marginal error should not be too high, otherwise it can lead to wrong conclusions which could have serious consequences. An acceptable margin of error used by most survey researchers typically falls between 4% and 8% at the 95% confidence level.
It is important to keep the margin of error as low as possible as the smaller the margin of error, the more confidence you may have in your results, the bigger the margin of error, the farther they can stray from the views of the total population, making your results unusable.
As a rule of thumb, as sample size grows marginal error decreases but, it should be noted that a too large sample size makes the survey more expensive and time consuming. Therefore, finding a balance between marginal error and sample size is essential. With proper planning you can make sure that your sample is representative of the target population, with marginal errors as low as possible so your results are accurate and reliable.
Let’s keep in mind that what is considered an acceptable value also depends on the kind of research you’re conducting. For obvious reasons, medical studies and trials have higher standards and stricter criteria when it comes to sampling and collecting results than researching consumers' purchasing behaviour.
Margin of error calculator
Use our calculator to quickly check the margin of error for your study. Just enter your values and check the result. All metrics used in the calculator are explained in detail below. If you have more questions, feel free to reach out to our experts via the chat.
An acceptable margin of error used by most researchers typically falls between 3% and 6% at the 95% confidence level.
The key values to calculate sample size and margin of error
The key values to determine the optimal sample size and / or margin of error are the total population N, the standard deviation p, confidence interval (CI) and the Z-value z.
Here is a brief explanation for every metric.
Standard deviation, p
When looking at survey results, you should be able to make general statements such as "xx% approve of this". However, this can vary greatly between respondents, which is why we also need to take into account standard deviation.
Standard deviation is expressed in percentage and specifies the range of probable answers for each question. The higher this value, the more participants are needed to obtain an accurate result.
The standard deviation value is usually set at 0.5 and indicates how much variation is expected in the answers of the respondents.
Here's an example of how a high standard deviation can occur when using a Likert scale question:
Imagine a survey is conducted to measure people's opinion on a new product. One of the questions is: How likely are you to recommend this product to a friend? Respondents reply via a Likert scale question with five options: "Strongly unlikely", "Unlikely", "Neutral", "Likely", "Strongly likely".
Out of 100 respondents, 50 of them choose "Strongly unlikely" and the other 50 choose "Strongly likely". This means there is no middle ground in the responses, they are all at one of the two extremes.
As we have half of the respondents choosing one extreme and the other half choosing the other extreme, the responses are not evenly distributed and the standard deviation would be much higher to indicate the large difference or spread between the responses.
This high standard deviation is unusual when compared to a "normal" distribution of responses, where you would expect most responses to be close to the average, with fewer responses at the extremes.
It is important to notice that a standard deviation value of 0.5 is considered a common value and typically only needs to be adjusted in edge cases, like the one mentioned in this example.
If you have a specific use case in mind and are unsure on what kind of standard deviation to expect, you can also contact our experts for support.
Z-score, z, and Confidence interval, (CI)
The Z-score measures how well the sample represents the total population (including the margin of error) and describes the deviation of a value from the average of your sample. Or in other words: The Z-value indicates how certain you could be that your study results correspond to reality.
As it is more tangible, confidence intervals that represent a certain z-score are usually used for calculating a desired sample size or margin of error. This table shows the z-scores for the most common confidence intervals.
| Confidence Interval | Z-value |
| 80% | 1,28 |
| 85% | 1,44 |
| 90% | 1,65 |
| 95% | 1,96 |
| 99% | 2,58 |
A confidence interval is a range of values, derived from a sample, that is used to estimate an unknown population parameter. It provides a level of certainty or confidence that the true population parameter falls within the interval.
The interval is calculated by taking a sample statistic (such as the mean or proportion) and adding and subtracting a margin of error, which is determined by the level of confidence desired and the sample size. The level of confidence is typically expressed as a percentage, such as 90%, 95%, or 99%.
The confidence interval is the range of values you expect your estimate to fall between if you redo your test, within a certain level of confidence.
Let’s use a visual example using a normal distribution.
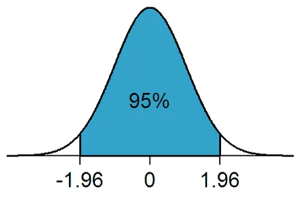
For example, the probability of the population mean value being between -1.96 and +1.96 standard deviations (z-scores) from the sample mean is 95%.
Accordingly, there is a 5% chance that the population mean lies outside of the upper and lower confidence interval (as illustrated by the 2.5% of outliers on either side of the 1.96 z-scores).
Total population, N
In most everyday uses, the word population implies a group of people or at least a group of living beings. However, statisticians and researchers refer to whatever group they are studying as a population.
The population of a study might be mothers of children under the age of 5 years old, doctors or users of a specific product.
In order to draw the most precise conclusions possible, statisticians and researchers would need to know all the characteristics of the people in the desired population, but this is impossible or impractical most of the time, since population sets tend to be quite large.
That’s why they select samples of the population, namely a smaller group drawn from the total population that has the characteristics of the entire population, so that the observations and conclusions made against the sample data can be attributed to the population as a whole.
In our Appinio calculator we do not consider the total population as for most studies the population size is so large (e.g. all Germans) that it doesn’t affect the required sample size or margin of error. Only when the population you want to investigate is extremely small - like all male dentists in London - the total population needs to be taken into account. In this case you can check out our advanced formula below or directly consult our experts for help.
The case of unknown population
In most cases, determining the population size precisely is not possible, because it is too large and broad. In these cases, you can only use the upper part of the standard formula to calculate the minimum sample size:
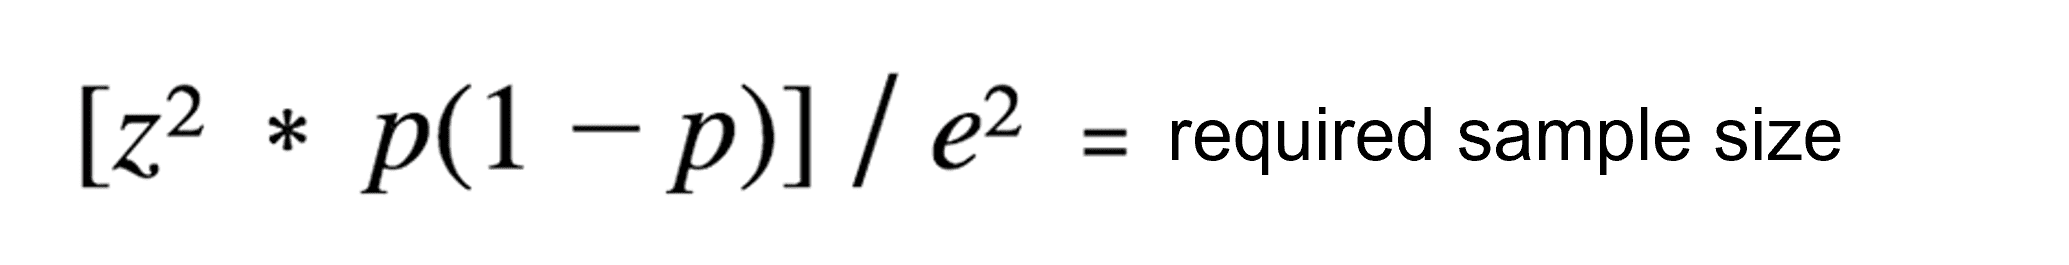
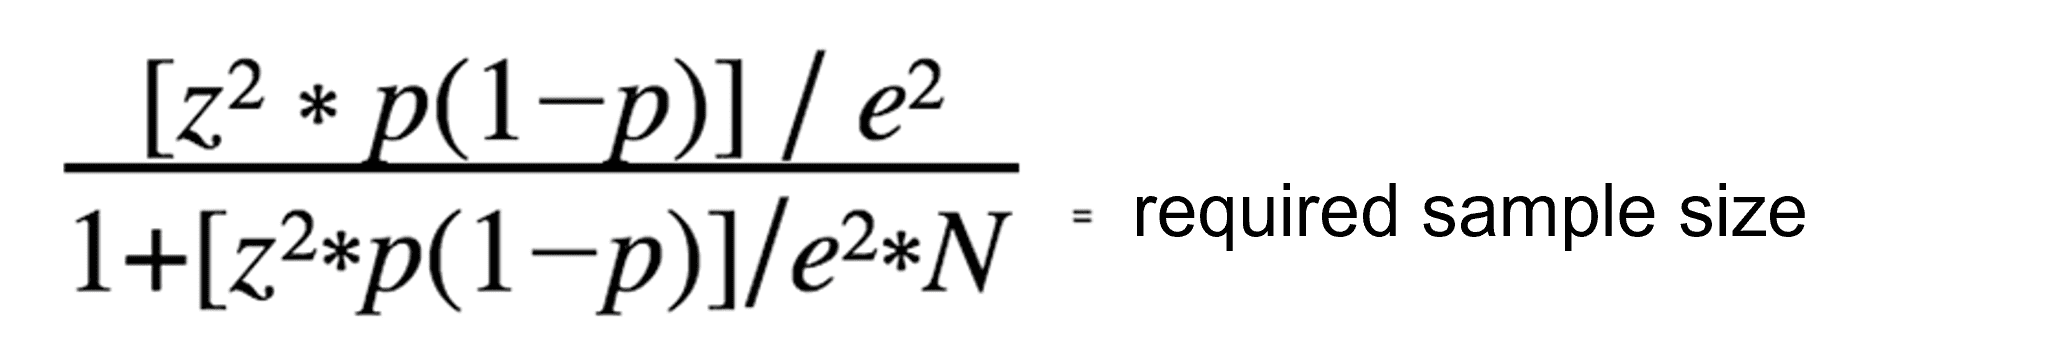
Formula for determining the sample size
For completion’s sake, we are also going to show you how you can calculate the appropriate sample size using the extended formula, but if you are not a fan of maths and formulas bring back school memories that you’d like to keep hidden, use our Appinio calculators above.
Once you determine all key values mentioned above, you can use the equation below to determine the optimal sample size. The following standard formula is best suited for small to medium population sizes.
 A calculation example: The starting point is a total population N = 500, a margin of error of 0.1, a standard deviation p of 0.5 and a Z-value of 1.96 (based on a confidence level of 95%). Then the following calculation results:
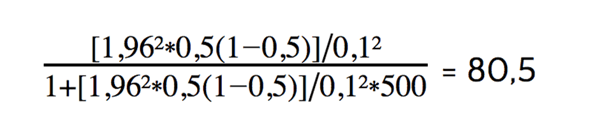 For the results to be representative of a total population of 500 respondents, the optimal sample size is at least 80 respondents.
Conclusions
In conclusion, a reliable sample size is critical for making accurate, representative and meaningful conclusions when conducting survey research. This ensures that marginal errors are minimised and that results can be extrapolated from the population with greater certainty. By following the outlined formula, you can determine the optimal sample size for your study to ensure accurate and reliable results.
We have discussed marginal error, sample size and the calculation of Z-value. To determine the sample size for a survey, you must use the standard formula and consider three key values: Margin of error, standard deviation, and Z-value. In specific use cases where you want to represent a very small population, population size needs to be considered additionally.
By following this formula, you can ensure accuracy and reliability in your survey results. The marginal error is a measure used to describe how well a sample represents the total population and refers to the likelihood of an error occurring. The Z-value is calculated based on the confidence level and indicates how certain you can be that your results correspond to reality. Finally, the sample size should be determined using the standard formula to minimise marginal errors and extrapolate results to the full population accurately.
Do you want to start your own survey but don't quite know how?
Have a look at the Appinio Hype Tracker Report!
For the Appinio Hype Tracker Reports we investigate a population that is representative according to age and gender.
Find all Appinio Hype Tracker volumes on our Report Page and register for the dashboard free of charge here.

