Appinio Research · 14.01.2025 · 32min read

Have you ever needed to find quick answers to pressing questions or solve unexpected problems in your business? Enter ad hoc analysis, a powerful approach that allows you to dive into your data on demand, uncover insights, and make informed decisions in real time.
In today's fast-paced world, where change is constant and uncertainties abound, having the ability to explore data flexibly and adaptively is invaluable. Whether you're trying to understand customer behavior, optimize operations, or mitigate risks, ad hoc analysis empowers you to extract actionable insights from your data swiftly and effectively. It's like having a flashlight in the dark, illuminating hidden patterns and revealing opportunities that may have otherwise gone unnoticed.
What is Ad Hoc Analysis?
Ad hoc analysis is a dynamic process that involves exploring data to answer specific questions or address immediate needs. Unlike routine reporting, which follows predefined formats and schedules, ad hoc analysis is driven by the need for timely insights and actionable intelligence. Its purpose is to uncover hidden patterns, trends, and relationships within data that may not be readily apparent, enabling organizations to make informed decisions and respond quickly to changing circumstances.
Ad hoc analysis involves the flexible and on-demand exploration of data to gain insights or solve specific problems. It allows analysts to dig deeper into datasets, ask ad hoc questions, and derive meaningful insights that may not have been anticipated beforehand. The term "ad hoc" is derived from Latin and means "for this purpose," emphasizing the improvised and opportunistic nature of this type of analysis.
Purpose of Ad Hoc Analysis
The primary purpose of ad hoc analysis is to support decision-making by providing timely and relevant insights into complex datasets. It allows organizations to:
- Identify emerging trends or patterns that may impact business operations.
- Investigate anomalies or outliers to understand their underlying causes.
- Explore relationships between variables to uncover opportunities or risks.
- Generate hypotheses and test assumptions in real time.
- Inform strategic planning, resource allocation, and risk management efforts.
By enabling analysts to explore data in an iterative and exploratory manner, ad hoc analysis empowers organizations to adapt to changing environments, seize opportunities, and mitigate risks effectively.
Importance of Ad Hoc Analysis in Decision Making
Ad hoc analysis plays a crucial role in decision-making across various industries and functions. Here are some key reasons why ad hoc analysis is important:
- Flexibility: Ad hoc analysis offers flexibility and agility, allowing organizations to respond quickly to evolving business needs and market dynamics. It enables decision-makers to explore new ideas, test hypotheses, and adapt strategies in real time.
- Customization: Unlike standardized reports or dashboards, ad hoc analysis allows for customization and personalization. Analysts can tailor their analyses to specific questions or problems, ensuring that insights are directly relevant to decision-makers needs.
- Insight Generation: Ad hoc analysis uncovers insights that may not be captured by routine reporting or predefined metrics. Analysts can uncover hidden patterns, trends, and correlations that drive innovation and competitive advantage by delving into data with a curious and open-minded approach.
- Risk Management: In today's fast-paced and uncertain business environment, proactive risk management is essential. Ad hoc analysis enables organizations to identify and mitigate risks by analyzing historical data, monitoring key indicators, and anticipating potential threats.
- Opportunity Identification: Ad hoc analysis helps organizations identify new opportunities for growth, innovation, and optimization. Analysts can uncover untapped markets, customer segments, or product offerings that drive revenue and profitability by exploring data from different angles and perspectives.
- Continuous Improvement: Ad hoc analysis fosters a culture of constant improvement and learning within organizations. By encouraging experimentation and exploration, organizations can drive innovation, refine processes, and stay ahead of the competition.
Ad hoc analysis is not just a tool for data analysis—it's a mindset and approach that empowers organizations to harness the full potential of their data, make better decisions, and achieve their strategic objectives.
Understanding Ad Hoc Analysis
Ad hoc analysis is a dynamic process that involves digging into your data to answer specific questions or solve immediate problems. Let's delve deeper into what it entails.
Ad Hoc Analysis Characteristics
At its core, ad hoc analysis refers to the flexible and on-demand examination of data to gain insights or address specific queries. Unlike routine reporting, which follows predetermined schedules, ad hoc analysis is triggered by the need to explore a particular issue or opportunity.
Its characteristics include:
- Flexibility: Ad hoc analysis adapts to the ever-changing needs of businesses, allowing analysts to explore data as new questions arise.
- Timeliness: It offers timely insights, enabling organizations to make informed decisions quickly in response to emerging issues or opportunities.
- Unstructured Nature: Ad hoc analysis often deals with unstructured or semi-structured data, requiring creativity and resourcefulness in data exploration.
Ad Hoc Analysis vs. Regular Reporting
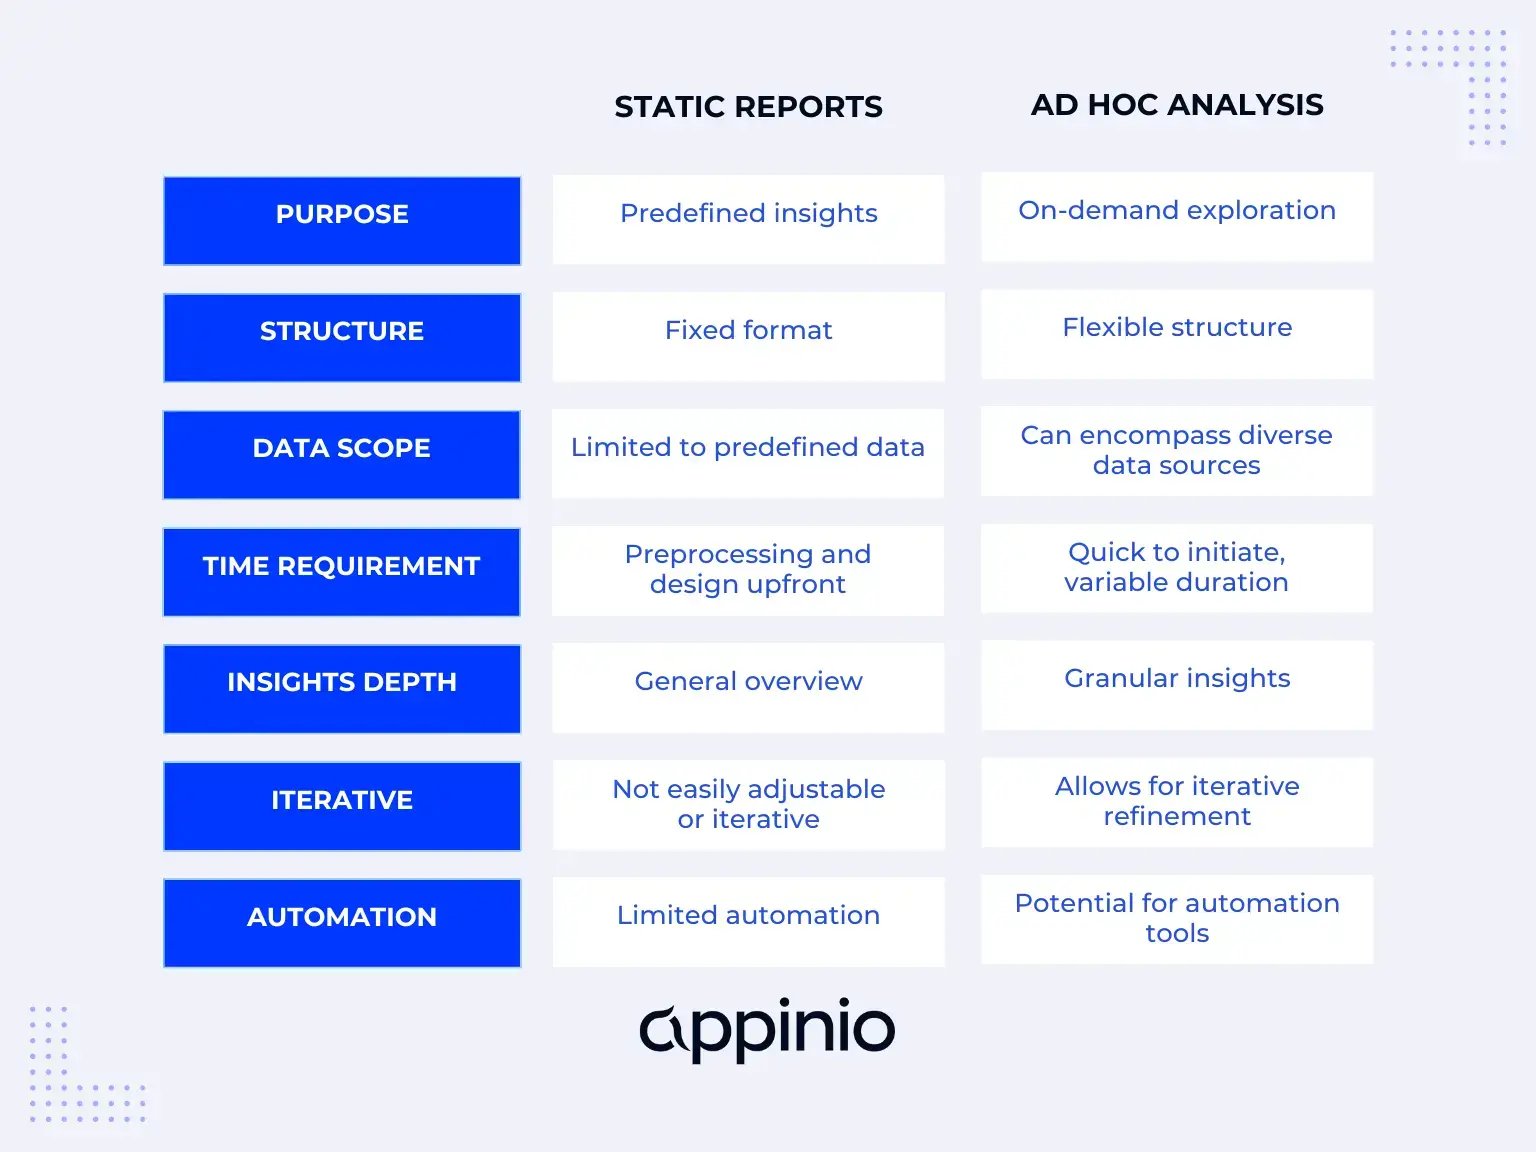 While regular reporting provides standardized insights on predetermined metrics, ad hoc analysis offers a more customized and exploratory approach. Here's how they differ:
- Purpose: Regular reporting aims to track key performance indicators (KPIs) over time, while ad hoc analysis seeks to uncover new insights or address specific questions.
- Frequency: Regular reporting occurs at regular intervals (e.g., daily, weekly, monthly), whereas ad hoc analysis occurs on an as-needed basis.
- Scope: Regular reporting focuses on predefined metrics and reports, whereas ad hoc analysis explores a wide range of data sources and questions.
Types of Ad Hoc Analysis
Ad hoc analysis encompasses various types, each serving distinct purposes in data exploration and decision-making. These types include:
- Exploratory Analysis: This type involves exploring data to identify patterns, trends, or relationships without predefined hypotheses. It's often used in the initial stages of data exploration.
- Diagnostic Analysis: Diagnostic analysis aims to uncover the root causes of observed phenomena or issues. It delves deeper into data to understand why specific outcomes occur.
- Predictive Analysis: Predictive analysis leverages historical data to forecast future trends, behaviors, or events. It employs statistical modeling and machine learning algorithms to make predictions based on past patterns.
Common Data Sources
Ad hoc analysis can draw upon a wide array of data sources, depending on the nature of the questions being addressed and the data availability. Common data sources include:
- Structured Data: This includes data stored in relational databases, spreadsheets, and data warehouses, typically organized in rows and columns.
- Unstructured Data: Unstructured data sources, such as text documents, social media feeds, and multimedia content, require specialized techniques for analysis.
- External Data: Organizations may also tap into external data sources, such as market research reports, government databases, or third-party APIs, to enrich their analyses.
Organizations can gain comprehensive insights and make more informed decisions by leveraging diverse data sources. Understanding these foundational aspects of ad hoc analysis is crucial for conducting effective data exploration and driving actionable insights.
How to Prepare for Ad Hoc Analysis?
Before diving into ad hoc analysis, it's crucial to lay a solid foundation by preparing adequately. This involves defining your objectives, gathering and organizing data, selecting the right tools, and ensuring data quality. Let's explore these steps in detail.
Defining Objectives and Questions
The first step in preparing for ad hoc analysis is to clearly define your objectives and formulate the questions you seek to answer.
- Identify Key Objectives: Determine the overarching goals of your analysis. What are you trying to achieve? Are you looking to optimize processes, identify growth opportunities, or solve a specific problem?
- Formulate Relevant Questions: Break down your objectives into specific, actionable questions. What information do you need to answer these questions? What insights are you hoping to uncover?
By defining clear objectives and questions, you can focus your analysis efforts and ensure that you gather the necessary data to address your specific needs.
Data Collection and Organization
Once you have defined your objectives and questions, the next step is to gather relevant data and organize it in a format conducive to analysis.
- Identify Data Sources: Determine where your data resides. This may include internal databases, third-party sources, or even manual sources such as surveys or interviews.
- Extract and Collect Data: Extract data from the identified sources and collect it in a central location. This may involve using data extraction tools, APIs, or manual data entry.
- Clean and Preprocess Data: Before conducting analysis, it's essential to clean and preprocess the data to ensure its quality and consistency. This may involve removing duplicates, handling missing values, and standardizing formats.
Organizing your data in a systematic manner will streamline the analysis process and ensure that you can easily access and manipulate the data as needed. For a streamlined data collection process that complements your ad hoc analysis needs, consider leveraging Appinio.
With its intuitive platform and robust capabilities, Appinio simplifies data collection from diverse sources, allowing you to gather real-time consumer insights effortlessly. By incorporating Appinio into your data collection strategy, you can expedite the process and focus on deriving actionable insights to drive your business forward.
Ready to experience the power of rapid data collection? Book a demo today and see how Appinio can revolutionize your ad hoc analysis workflow.
Tools and Software
Choosing the right tools and software is critical for conducting ad hoc analysis efficiently and effectively.
- Analytical Capabilities: Choose tools that offer a wide range of analytical capabilities, including data visualization, statistical analysis, and predictive modeling.
- Ease of Use: Look for user-friendly and intuitive tools, especially if you're not a seasoned data analyst. This will reduce the learning curve and enable you to get up and running quickly.
- Compatibility: Ensure the tools you choose are compatible with your existing systems and data sources. This will facilitate seamless integration and data exchange.
- Scalability: Consider the tools' scalability, especially if your analysis needs are likely to grow over time. Choose tools that can accommodate larger datasets and more complex analyses.
Popular tools for ad hoc analysis include Microsoft Excel and Python with libraries like Pandas and NumPy, R, and business intelligence platforms like Tableau and Power BI.
Data Quality Assurance
Ensuring the quality of your data is paramount for obtaining reliable insights and making informed decisions. To assess and maintain data quality:
- Data Validation: Perform data validation checks to ensure the data is accurate, complete, and consistent. This may involve verifying data against predefined rules or business logic.
- Data Cleansing: Cleanse the data by removing duplicates, correcting errors, and standardizing formats. This will help eliminate discrepancies and ensure uniformity across the dataset.
- Data Governance: Implement data governance policies and procedures to maintain data integrity and security. This may include access controls, data encryption, and regular audits.
- Continuous Monitoring: Continuously monitor data quality metrics and address any issues that arise promptly. This will help prevent data degradation over time and ensure your analyses are based on reliable information.
By prioritizing data quality assurance, you can enhance the accuracy and reliability of your ad hoc analyses, leading to more confident decision-making and better outcomes.
How to Perform Ad Hoc Analysis?
Now that you've prepared your data and defined your objectives, it's time to conduct ad hoc analysis. This involves selecting appropriate analytical techniques, exploring your data, applying advanced statistical methods, visualizing your findings, and validating hypotheses.
Choosing Analytical Techniques
Selecting the proper analytical techniques is crucial for extracting meaningful insights from your data.
- Nature of the Data: Assess the nature of your data, including its structure, size, and complexity. Different techniques may be more suitable for structured versus unstructured data or small versus large datasets.
- Objectives of Analysis: Align the choice of techniques with your analysis objectives. Are you trying to identify patterns, relationships, anomalies, or trends? Choose techniques that are well-suited to address your specific questions.
- Expertise and Resources: Consider your team's knowledge and the availability of resources, such as computational power and software tools. Choose techniques that your team is comfortable with and that can be executed efficiently.
Standard analytical techniques include descriptive statistics, inferential statistics, machine learning algorithms, and data mining techniques.
Exploratory Data Analysis (EDA)
Exploratory Data Analysis (EDA) is a critical step in ad hoc analysis that involves uncovering patterns, trends, and relationships within your data. Here's how to approach EDA:
- Summary Statistics: Calculate summary statistics such as mean, median, mode, variance, and standard deviation to understand the central tendencies and variability of your data.
- Data Visualization: Visualize your data using charts, graphs, and plots to identify patterns and outliers. Popular visualization techniques include histograms, scatter plots, box plots, and heat maps.
- Correlation Analysis: Explore correlations between variables to understand how they are related to each other. Use correlation matrices and scatter plots to visualize relationships.
- Dimensionality Reduction: If working with high-dimensional data, consider using dimensionality reduction techniques such as principal component analysis (PCA) or t-distributed stochastic neighbor embedding (t-SNE) to visualize and explore the data in lower dimensions.
Advanced Statistical Methods
For more in-depth analysis, consider applying advanced statistical methods to your data. These methods can help uncover hidden insights and relationships. Some advanced statistical methods include:
- Regression Analysis: Use regression analysis to model the relationship between dependent and independent variables. Linear regression, logistic regression, and multivariate regression are common techniques.
- Hypothesis Testing: Conduct hypothesis tests to assess the statistical significance of observed differences or relationships. Standard tests include t-tests, chi-square tests, ANOVA, and Mann-Whitney U tests.
- Time Series Analysis: If working with time series data, apply time-series analysis techniques to understand patterns and trends over time. This may involve methods such as autocorrelation, seasonal decomposition, and forecasting.
Data Visualization
Visualizing your findings is essential for communicating insights effectively to stakeholders.
- Choose the Right Visualizations: Select visualizations that best represent your data and convey your key messages. Consider factors such as the type of data, the relationships you want to highlight, and the audience's preferences.
- Use Clear Labels and Titles: Ensure that your visualizations are easy to interpret by using clear labels, titles, and legends. Avoid clutter and unnecessary decorations that may distract from the main message.
- Interactive Visualizations: If possible, create interactive visualizations allowing users to explore the data interactively. This can enhance engagement and enable users to gain deeper insights by drilling down into specific data points.
- Accessibility: Make your visualizations accessible to all users, including those with visual impairments. Use appropriate color schemes, font sizes, and contrast ratios to ensure readability.
Iterative Approach and Hypothesis Testing
Adopting an iterative approach to analysis allows you to refine your hypotheses and validate your findings through hypothesis testing.
- Formulate Hypotheses: Based on your initial explorations, formulate hypotheses about the relationships or patterns in the data that you want to test.
- Design Experiments: Design experiments or tests to evaluate your hypotheses. This may involve collecting additional data or conducting statistical tests.
- Evaluate Results: Analyze the results of your experiments and assess whether they support or refute your hypotheses. Consider factors such as statistical significance, effect size, and practical significance.
- Iterate as Needed: If the results are inconclusive or unexpected, iterate on your analysis by refining your hypotheses and conducting further investigations. This iterative process helps ensure that your conclusions are robust and reliable.
By following these steps and techniques, you can perform ad hoc analysis effectively, uncover valuable insights, and make informed decisions based on data-driven evidence.
Ad Hoc Analysis Examples
To better understand how ad hoc analysis can be applied in real-world scenarios, let's explore some examples across different industries and domains:
1. Marketing Campaign Optimization
Imagine you're a marketing analyst tasked with optimizing a company's digital advertising campaigns. Through ad hoc analysis, you can delve into various metrics such as click-through rates, conversion rates, and return on ad spend (ROAS) to identify trends and patterns. For instance, you may discover that certain demographic segments or ad creatives perform better than others. By iteratively testing and refining different campaign strategies based on these insights, you can improve overall campaign performance and maximize ROI.
2. Supply Chain Optimization
In the realm of supply chain management, ad hoc analysis can play a critical role in identifying inefficiencies and optimizing processes. For example, you might analyze historical sales data, inventory levels, and production schedules to identify bottlenecks or excess inventory. Through exploratory analysis, you may uncover seasonal demand patterns or supply chain disruptions that impact operations. Armed with these insights, supply chain managers can make data-driven decisions to streamline operations, reduce costs, and improve customer satisfaction.
3. Retail Merchandising Analysis
In the retail industry, ad hoc analysis is used to optimize merchandising strategies, pricing decisions, and inventory management. Retailers may analyze sales data, customer demographics, and market trends to identify product preferences and purchasing behaviors. Through segmentation analysis, retailers can tailor their merchandising efforts to specific customer segments and optimize product assortments. By monitoring key performance indicators (KPIs) such as sell-through rates and inventory turnover, retailers can make data-driven decisions to maximize sales and profitability.
How to Report Ad Hoc Analysis Findings?
After conducting ad hoc analysis, effectively communicating your findings is essential for driving informed decision-making within your organization. Let's explore how to structure your report, interpret and communicate results, tailor reports to different audiences, incorporate visual aids, and document methods and assumptions.
1. Structure the Report
Structuring your report in a clear and logical manner enhances readability and ensures that your findings are presented in a cohesive manner.
- Executive Summary: Provide a brief overview of your analysis, including the objectives, key findings, and recommendations. This section should concisely summarize the main points of your report.
- Introduction: Introduce the purpose and scope of the analysis, as well as any background information or context that is relevant to understanding the findings.
- Methodology: Describe the methods and techniques used in the analysis, including data collection, analytical approaches, and any assumptions made.
- Findings: Present the main findings of your analysis, organized in a logical sequence. Use headings, subheadings, and bullet points to enhance clarity and readability.
- Discussion: Interpret the findings in the context of the objectives and provide insights into their implications. Discuss any patterns, trends, or relationships observed in the data.
- Recommendations: Based on the analysis findings, provide actionable recommendations. Clearly outline the steps to address any issues or capitalize on opportunities identified.
- Conclusion: Summarize the main findings and recommendations, reiterating their importance and potential impact on the organization.
- References: Include a list of references or citations for any sources of information or data used in the analysis.
2. Interpret and Communicate Results
Interpreting and communicating the results of your analysis effectively is crucial for ensuring that stakeholders understand the implications and can make informed decisions.
- Use Plain Language: Avoid technical jargon and complex terminology that may confuse or alienate non-technical stakeholders. Use plain language to explain concepts and findings in a clear and accessible manner.
- Provide Context: Help stakeholders understand the significance of the findings by providing relevant context and background information. Explain why the analysis was conducted and how the findings relate to broader organizational goals or objectives.
- Highlight Key Insights: Focus on the most important insights and findings rather than overwhelming stakeholders with excessive detail. Use visual aids, summaries, and bullet points to highlight key takeaways.
- Address Implications: Discuss the implications of the findings and their potential impact on the organization. Consider both short-term and long-term implications and any risks or uncertainties.
- Encourage Dialogue: Foster open communication and encourage stakeholders to ask questions and seek clarification. Be prepared to engage in discussions and provide additional context or information as needed.
3. Tailor Reports to Different Audiences
Different stakeholders may have varying levels of expertise and interests, so it's essential to tailor your reports to meet their specific needs and preferences.
- Executive Summary for Decision Makers: Provide a concise executive summary highlighting key findings and recommendations for senior leaders and decision-makers who may not have time to review the full report.
- Detailed Analysis for Analysts: Include more thorough analysis, methodologies, and supporting data for analysts or technical stakeholders who require a deeper understanding of the analysis process and results.
- Customized Dashboards or Visualizations: Create customized dashboards or visualizations for different audiences, allowing them to interact with the data and explore insights relevant to their areas of interest.
- Personalized Presentations: Deliver personalized presentations or briefings to different stakeholder groups, focusing on the aspects of the analysis most relevant to their roles or responsibilities.
By tailoring your reports to different audiences, you can ensure that each stakeholder receives the information they need in a meaningful and actionable format.
4. Incorporate Visual Aids
Visual aids such as charts, graphs, and diagrams can enhance the clarity and impact of your reports by making complex information more accessible and engaging.
- Choose Appropriate Visualizations: Select visualizations that best represent the data and convey the key messages of your analysis. Choose from various chart types, including bar charts, line charts, pie charts, scatter plots, and heat maps.
- Simplify Complex Data: Use visualizations to simplify complex data and highlight trends, patterns, or relationships. Avoid clutter and unnecessary detail that may detract from the main message.
- Ensure Readability: Use clear labels, titles, and legends to ensure that visualizations are easy to read and interpret. Use appropriate colors, fonts, and formatting to enhance readability and accessibility.
- Use Interactive Features: If possible, incorporate interactive features into your visualizations that allow stakeholders to explore the data further. This can enhance engagement and enable stakeholders to gain deeper insights by drilling down into specific data points.
- Provide Context: Provide context and annotations to help stakeholders understand the significance of the visualizations and how they relate to the analysis objectives.
By incorporating visual aids effectively, you can make your reports more engaging and persuasive, helping stakeholders better understand and act on the findings of your analysis.
5. Document Methods and Assumptions
Documenting the methods and assumptions used in your analysis is essential for transparency and reproducibility. It allows stakeholders to understand how the findings were obtained and evaluate their reliability.
- Describe Data Sources and Collection Methods: Provide details about the sources of data used in the analysis and the methods used to collect and prepare the data for analysis.
- Explain Analytical Techniques: Describe the analytical techniques and methodologies used in the analysis, including any statistical methods, algorithms, or models employed.
- Document Assumptions and Limitations: Clearly state any assumptions made during the analysis, as well as any limitations or constraints that may impact the validity of the findings. Be transparent about the uncertainties and risks associated with the analysis.
- Provide Reproducible Code or Scripts: If applicable, provide reproducible code or scripts that allow others to replicate the analysis independently. This can include programming code, SQL queries, or data manipulation scripts.
- Include References and Citations: Provide references or citations for any external sources of information or data used in the analysis, ensuring that proper credit is given and allowing stakeholders to access additional information if needed.
By documenting methods and assumptions thoroughly, you can build trust and credibility with stakeholders and facilitate collaboration and knowledge sharing within your organization.
Ad Hoc Analysis Best Practices
Performing ad hoc analysis effectively requires a combination of skills, techniques, and strategies. Here are some best practices and tips to help you conduct ad hoc analysis more efficiently and derive valuable insights:
- Define Clear Objectives: Before analyzing the data, clearly define the objectives and questions you seek to answer. This will help you focus your efforts and ensure that you stay on track.
- Start with Exploratory Analysis: Begin your analysis with exploratory techniques to gain an initial understanding of the data and identify any patterns or trends. This will provide valuable insights that can guide further analysis.
- Iterate and Refine: Adopt an iterative approach to analysis, refining your hypotheses and techniques based on initial findings. Be open to adjusting your approach as new insights emerge.
- Leverage Diverse Data Sources: Tap into diverse data sources to enrich your analysis and gain comprehensive insights. Consider both internal and external sources of data that may provide valuable context or information.
- Maintain Data Quality: Prioritize data quality assurance throughout the analysis process, ensuring your findings are based on accurate, reliable data. Cleanse, validate, and verify the data to minimize errors and inconsistencies.
- Document Processes and Assumptions: Document the methods, assumptions, and decisions made during the analysis to ensure transparency and reproducibility. This will facilitate collaboration and knowledge sharing within your organization.
- Communicate Findings Effectively: Use clear, concise language to communicate your findings and recommendations to stakeholders. Tailor your reports and presentations to the needs and preferences of different audiences.
- Stay Curious and Open-Minded: Approach ad hoc analysis with curiosity and an open mind, remaining receptive to unexpected insights and discoveries. Embrace uncertainty and ambiguity as opportunities for learning and exploration.
- Seek Feedback and Collaboration: Solicit feedback from colleagues, mentors, and stakeholders throughout the analysis process. Collaboration and peer review can help validate findings and identify blind spots or biases.
- Continuously Learn and Improve: Invest in ongoing learning and professional development to expand your analytical skills and stay abreast of emerging trends and techniques in data analysis.
Ad Hoc Analysis Challenges
While ad hoc analysis offers numerous benefits, it also presents unique challenges that analysts must navigate. Here are some common challenges associated with ad hoc analysis:
- Data Quality Issues: Poor data quality, including missing values, errors, and inconsistencies, can hinder the accuracy and reliability of ad hoc analysis results. Addressing data quality issues requires careful data cleansing and validation.
- Time Constraints: Ad hoc analysis often needs to be performed quickly to respond to immediate business needs or opportunities. Time constraints can limit the depth and thoroughness of analysis, requiring analysts to prioritize key insights.
- Resource Limitations: Limited access to data, tools, or expertise can pose challenges for ad hoc analysis. Organizations may need to invest in training, infrastructure, or external resources to support effective analysis.
- Complexity of Unstructured Data: Dealing with unstructured or semi-structured data, such as text documents or social media feeds, can be challenging. Analysts must employ specialized techniques and tools to extract insights from these data types.
- Overcoming Analytical Bias: Analysts may inadvertently introduce biases into their analysis, leading to skewed or misleading results. It's essential to remain vigilant and transparent about potential biases and take steps to mitigate them.
By recognizing and addressing these challenges, analysts can enhance the effectiveness and credibility of their ad hoc analysis efforts, ultimately driving more informed decision-making within their organizations.
Conclusion for Ad Hoc Analysis
Ad hoc analysis is a versatile tool that empowers organizations to navigate the complexities of data and make informed decisions quickly. By enabling analysts to explore data on demand, ad hoc analysis provides a flexible and adaptive approach to problem-solving, allowing organizations to respond effectively to changing circumstances and capitalize on opportunities. By embracing the principles of ad hoc analysis and incorporating best practices into their workflows, organizations can unlock the full potential of their data and drive business success.
In today's data-driven world, the ability to extract actionable insights from data is more critical than ever. Ad hoc analysis offers a pathway to deeper understanding and better decision-making, enabling organizations to stay agile, competitive, and resilient in the face of uncertainty. As technology continues to evolve and data volumes grow exponentially, the importance of ad hoc analysis will only continue to increase. So, whether you're a seasoned data analyst or just beginning your journey into data analysis, embracing ad hoc analysis can lead to better outcomes and brighter futures for your organization.
How to Quickly Collect Data for Ad Hoc Analysis?
Introducing Appinio, your gateway to lightning-fast market research within the realm of ad hoc analysis. As a real-time market research platform, Appinio specializes in delivering immediate consumer insights, empowering companies to make swift, data-driven decisions.
With Appinio, conducting your own market research becomes a breeze:
- Lightning-fast Insights: From questions to insights in mere minutes, Appinio accelerates the pace of ad hoc analysis, ensuring you get the answers you need precisely when you need them.
- Intuitive Platform: No need for a PhD in research—Appinio's platform is designed to be user-friendly and accessible to all, allowing anyone to conduct sophisticated market research effortlessly.
- Global Reach: With access to over 90 countries and the ability to define precise target groups from 1200+ characteristics, Appinio enables you to gather insights from diverse demographics worldwide, all with an average field time of under 23 minutes for 1,000 respondents.

