Appinio Research · 30.04.2026 · 36min read

Have you ever faced a complex decision, wondering how to make the best choice among multiple options? In a world filled with data and possibilities, the art of comparative analysis holds the key to unlocking clarity amidst the chaos.
In this guide, we'll demystify the power of comparative analysis, revealing its practical applications, methodologies, and best practices. Whether you're a business leader, researcher, or simply someone seeking to make more informed decisions, join us as we explore the intricacies of comparative analysis and equip you with the tools to chart your course with confidence.
What is Comparative Analysis?
Comparative analysis is a systematic approach used to evaluate and compare two or more entities, variables, or options to identify similarities, differences, and patterns. It involves assessing the strengths, weaknesses, opportunities, and threats associated with each entity or option to make informed decisions.
The primary purpose of comparative analysis is to provide a structured framework for decision-making by:
- Facilitating Informed Choices: Comparative analysis equips decision-makers with data-driven insights, enabling them to make well-informed choices among multiple options.
- Identifying Trends and Patterns: It helps identify recurring trends, patterns, and relationships among entities or variables, shedding light on underlying factors influencing outcomes.
- Supporting Problem Solving: Comparative analysis aids in solving complex problems by systematically breaking them down into manageable components and evaluating potential solutions.
- Enhancing Transparency: By comparing multiple options, comparative analysis promotes transparency in decision-making processes, allowing stakeholders to understand the rationale behind choices.
- Mitigating Risks: It helps assess the risks associated with each option, allowing organizations to develop risk mitigation strategies and make risk-aware decisions.
- Optimizing Resource Allocation: Comparative analysis assists in allocating resources efficiently by identifying areas where resources can be optimized for maximum impact.
- Driving Continuous Improvement: By comparing current performance with historical data or benchmarks, organizations can identify improvement areas and implement growth strategies.
Importance of Comparative Analysis in Decision-Making
- Data-Driven Decision-Making: Comparative analysis relies on empirical data and objective evaluation, reducing the influence of biases and subjective judgments in decision-making. It ensures decisions are based on facts and evidence.
- Objective Assessment: It provides an objective and structured framework for evaluating options, allowing decision-makers to focus on key criteria and avoid making decisions solely based on intuition or preferences.
- Risk Assessment: Comparative analysis helps assess and quantify risks associated with different options. This risk awareness enables organizations to make proactive risk management decisions.
- Prioritization: By ranking options based on predefined criteria, comparative analysis enables decision-makers to prioritize actions or investments, directing resources to areas with the most significant impact.
- Strategic Planning: It is integral to strategic planning, helping organizations align their decisions with overarching goals and objectives. Comparative analysis ensures decisions are consistent with long-term strategies.
- Resource Allocation: Organizations often have limited resources. Comparative analysis assists in allocating these resources effectively, ensuring they are directed toward initiatives with the highest potential returns.
- Continuous Improvement: Comparative analysis supports a culture of continuous improvement by identifying areas for enhancement and guiding iterative decision-making processes.
- Stakeholder Communication: It enhances transparency in decision-making, making it easier to communicate decisions to stakeholders. Stakeholders can better understand the rationale behind choices when supported by comparative analysis.
- Competitive Advantage: In business and competitive environments, comparative analysis can provide a competitive edge by identifying opportunities to outperform competitors or address weaknesses.
- Informed Innovation: When evaluating new products, technologies, or strategies, comparative analysis guides the selection of the most promising options, reducing the risk of investing in unsuccessful ventures.
In summary, comparative analysis is a valuable tool that empowers decision-makers across various domains to make informed, data-driven choices, manage risks, allocate resources effectively, and drive continuous improvement. Its structured approach enhances decision quality and transparency, contributing to the success and competitiveness of organizations and research endeavors.
How to Prepare for Comparative Analysis?
1. Define Objectives and Scope
Before you begin your comparative analysis, clearly defining your objectives and the scope of your analysis is essential. This step lays the foundation for the entire process. Here's how to approach it:
- Identify Your Goals: Start by asking yourself what you aim to achieve with your comparative analysis. Are you trying to choose between two products for your business? Are you evaluating potential investment opportunities? Knowing your objectives will help you stay focused throughout the analysis.
- Define Scope: Determine the boundaries of your comparison. What will you include, and what will you exclude? For example, if you're analyzing market entry strategies for a new product, specify whether you're looking at a specific geographic region or a particular target audience.
- Stakeholder Alignment: Ensure that all stakeholders involved in the analysis understand and agree on the objectives and scope. This alignment will prevent misunderstandings and ensure the analysis meets everyone's expectations.
2. Gather Relevant Data and Information
The quality of your comparative analysis heavily depends on the data and information you gather. Here's how to approach this crucial step:
- Data Sources: Identify where you'll obtain the necessary data. Will you rely on primary sources, such as surveys and interviews, to collect original data? Or will you use secondary sources, like published research and industry reports, to access existing data? Consider the advantages and disadvantages of each source.
- Data Collection Plan: Develop a plan for collecting data. This should include details about the methods you'll use, the timeline for data collection, and who will be responsible for gathering the data.
- Data Relevance: Ensure that the data you collect is directly relevant to your objectives. Irrelevant or extraneous data can lead to confusion and distract from the core analysis.
3. Select Appropriate Criteria for Comparison
Choosing the right criteria for comparison is critical to a successful comparative analysis. Here's how to go about it:
- Relevance to Objectives: Your chosen criteria should align closely with your analysis objectives. For example, if you're comparing job candidates, your criteria might include skills, experience, and cultural fit.
- Measurability: Consider whether you can quantify the criteria. Measurable criteria are easier to analyze. If you're comparing marketing campaigns, you might measure criteria like click-through rates, conversion rates, and return on investment.
- Weighting Criteria: Not all criteria are equally important. You'll need to assign weights to each criterion based on its relative importance. Weighting helps ensure that the most critical factors have a more significant impact on the final decision.
4. Establish a Clear Framework
Once you have your objectives, data, and criteria in place, it's time to establish a clear framework for your comparative analysis. This framework will guide your process and ensure consistency. Here's how to do it:
- Comparative Matrix: Consider using a comparative matrix or spreadsheet to organize your data. Each row in the matrix represents an option or entity you're comparing, and each column corresponds to a criterion. This visual representation makes it easy to compare and contrast data.
- Timeline: Determine the time frame for your analysis. Is it a one-time comparison, or will you conduct ongoing analyses? Having a defined timeline helps you manage the analysis process efficiently.
- Define Metrics: Specify the metrics or scoring system you'll use to evaluate each criterion. For example, if you're comparing potential office locations, you might use a scoring system from 1 to 5 for factors like cost, accessibility, and amenities.
With your objectives, data, criteria, and framework established, you're ready to move on to the next phase of comparative analysis: data collection and organization.
Comparative Analysis Data Collection
Data collection and organization are critical steps in the comparative analysis process. We'll explore how to gather and structure the data you need for a successful analysis.
1. Utilize Primary Data Sources
Primary data sources involve gathering original data directly from the source. This approach offers unique advantages, allowing you to tailor your data collection to your specific research needs.
Some popular primary data sources include:
- Surveys and Questionnaires: Design surveys or questionnaires and distribute them to collect specific information from individuals or groups. This method is ideal for obtaining firsthand insights, such as customer preferences or employee feedback.
- Interviews: Conduct structured interviews with relevant stakeholders or experts. Interviews provide an opportunity to delve deeper into subjects and gather qualitative data, making them valuable for in-depth analysis.
- Observations: Directly observe and record data from real-world events or settings. Observational data can be instrumental in fields like anthropology, ethnography, and environmental studies.
- Experiments: In controlled environments, experiments allow you to manipulate variables and measure their effects. This method is common in scientific research and product testing.
When using primary data sources, consider factors like sample size, survey design, and data collection methods to ensure the reliability and validity of your data.
2. Harness Secondary Data Sources
Secondary data sources involve using existing data collected by others. These sources can provide a wealth of information and save time and resources compared to primary data collection.
Here are common types of secondary data sources:
- Public Records: Government publications, census data, and official reports offer valuable information on demographics, economic trends, and public policies. They are often free and readily accessible.
- Academic Journals: Scholarly articles provide in-depth research findings across various disciplines. They are helpful for accessing peer-reviewed studies and staying current with academic discourse.
- Industry Reports: Industry-specific reports and market research publications offer insights into market trends, consumer behavior, and competitive landscapes. They are essential for businesses making strategic decisions.
- Online Databases: Online platforms like Statista, PubMed, and Google Scholar provide a vast repository of data and research articles. They offer search capabilities and access to a wide range of data sets.
When using secondary data sources, critically assess the credibility, relevance, and timeliness of the data. Ensure that it aligns with your research objectives.
3. Ensure and Validate Data Quality
Data quality is paramount in comparative analysis. Poor-quality data can lead to inaccurate conclusions and flawed decision-making. Here's how to ensure data validation and reliability:
- Cross-Verification: Whenever possible, cross-verify data from multiple sources. Consistency among different sources enhances the reliability of the data.
- Sample Size: Ensure that your data sample size is statistically significant for meaningful analysis. A small sample may not accurately represent the population.
- Data Integrity: Check for data integrity issues, such as missing values, outliers, or duplicate entries. Address these issues before analysis to maintain data quality.
- Data Source Reliability: Assess the reliability and credibility of the data sources themselves. Consider factors like the reputation of the institution or organization providing the data.
4. Organize Data Effectively
Structuring your data for comparison is a critical step in the analysis process. Organized data makes it easier to draw insights and make informed decisions. Here's how to structure data effectively:
- Data Cleaning: Before analysis, clean your data to remove inconsistencies, errors, and irrelevant information. Data cleaning may involve data transformation, imputation of missing values, and removing outliers.
- Normalization: Standardize data to ensure fair comparisons. Normalization adjusts data to a standard scale, making comparing variables with different units or ranges possible.
- Variable Labeling: Clearly label variables and data points for easy identification. Proper labeling enhances the transparency and understandability of your analysis.
- Data Organization: Organize data into a format that suits your analysis methods. For quantitative analysis, this might mean creating a matrix, while qualitative analysis may involve categorizing data into themes.
By paying careful attention to data collection, validation, and organization, you'll set the stage for a robust and insightful comparative analysis. Next, we'll explore various methodologies you can employ in your analysis, ranging from qualitative approaches to quantitative methods and examples.
Comparative Analysis Methods
When it comes to comparative analysis, various methodologies are available, each suited to different research goals and data types. In this section, we'll explore five prominent methodologies in detail.
Qualitative Comparative Analysis (QCA)
Qualitative Comparative Analysis (QCA) is a methodology often used when dealing with complex, non-linear relationships among variables. It seeks to identify patterns and configurations among factors that lead to specific outcomes.
- Case-by-Case Analysis: QCA involves evaluating individual cases (e.g., organizations, regions, or events) rather than analyzing aggregate data. Each case's unique characteristics are considered.
- Boolean Logic: QCA employs Boolean algebra to analyze data. Variables are categorized as either present or absent, allowing for the examination of different combinations and logical relationships.
- Necessary and Sufficient Conditions: QCA aims to identify necessary and sufficient conditions for a specific outcome to occur. It helps answer questions like, "What conditions are necessary for a successful product launch?"
- Fuzzy Set Theory: In some cases, QCA may use fuzzy set theory to account for degrees of membership in a category, allowing for more nuanced analysis.
QCA is particularly useful in fields such as sociology, political science, and organizational studies, where understanding complex interactions is essential.
Quantitative Comparative Analysis
Quantitative Comparative Analysis involves the use of numerical data and statistical techniques to compare and analyze variables. It's suitable for situations where data is quantitative, and relationships can be expressed numerically.
- Statistical Tools: Quantitative comparative analysis relies on statistical methods like regression analysis, correlation, and hypothesis testing. These tools help identify relationships, dependencies, and trends within datasets.
- Data Measurement: Ensure that variables are measured consistently using appropriate scales (e.g., ordinal, interval, ratio) for meaningful analysis. Variables may include numerical values like revenue, customer satisfaction scores, or product performance metrics.
- Data Visualization: Create visual representations of data using charts, graphs, and plots. Visualization aids in understanding complex relationships and presenting findings effectively.
- Statistical Significance: Assess the statistical significance of relationships. Statistical significance indicates whether observed differences or relationships are likely to be real rather than due to chance.
Quantitative comparative analysis is commonly applied in economics, social sciences, and market research to draw empirical conclusions from numerical data.
Case Studies
Case studies involve in-depth examinations of specific instances or cases to gain insights into real-world scenarios. Comparative case studies allow researchers to compare and contrast multiple cases to identify patterns, differences, and lessons.
- Narrative Analysis: Case studies often involve narrative analysis, where researchers construct detailed narratives of each case, including context, events, and outcomes.
- Contextual Understanding: In comparative case studies, it's crucial to consider the context within which each case operates. Understanding the context helps interpret findings accurately.
- Cross-Case Analysis: Researchers conduct cross-case analysis to identify commonalities and differences across cases. This process can lead to the discovery of factors that influence outcomes.
- Triangulation: To enhance the validity of findings, researchers may use multiple data sources and methods to triangulate information and ensure reliability.
Case studies are prevalent in fields like psychology, business, and sociology, where deep insights into specific situations are valuable.
SWOT Analysis
SWOT Analysis is a strategic tool used to assess the Strengths, Weaknesses, Opportunities, and Threats associated with a particular entity or situation. While it's commonly used in business, it can be adapted for various comparative analyses.
- Internal and External Factors: SWOT Analysis examines both internal factors (Strengths and Weaknesses), such as organizational capabilities, and external factors (Opportunities and Threats), such as market conditions and competition.
- Strategic Planning: The insights from SWOT Analysis inform strategic decision-making. By identifying strengths and opportunities, organizations can leverage their advantages. Likewise, addressing weaknesses and threats helps mitigate risks.
- Visual Representation: SWOT Analysis is often presented as a matrix or a 2x2 grid, making it visually accessible and easy to communicate to stakeholders.
- Continuous Monitoring: SWOT Analysis is not a one-time exercise. Organizations use it periodically to adapt to changing circumstances and make informed decisions.
SWOT Analysis is versatile and can be applied in business, healthcare, education, and any context where a structured assessment of factors is needed.
Benchmarking
Benchmarking involves comparing an entity's performance, processes, or practices to those of industry leaders or best-in-class organizations. It's a powerful tool for continuous improvement and competitive analysis.
- Identify Performance Gaps: Benchmarking helps identify areas where an entity lags behind its peers or industry standards. These performance gaps highlight opportunities for improvement.
- Data Collection: Gather data on key performance metrics from both internal and external sources. This data collection phase is crucial for meaningful comparisons.
- Comparative Analysis: Compare your organization's performance data with that of benchmark organizations. This analysis can reveal where you excel and where adjustments are needed.
- Continuous Improvement: Benchmarking is a dynamic process that encourages continuous improvement. Organizations use benchmarking findings to set performance goals and refine their strategies.
Benchmarking is widely used in business, manufacturing, healthcare, and customer service to drive excellence and competitiveness.
Each of these methodologies brings a unique perspective to comparative analysis, allowing you to choose the one that best aligns with your research objectives and the nature of your data. The choice between qualitative and quantitative methods, or a combination of both, depends on the complexity of the analysis and the questions you seek to answer.
How to Conduct Comparative Analysis?
Once you've prepared your data and chosen an appropriate methodology, it's time to dive into the process of conducting a comparative analysis. We will guide you through the essential steps to extract meaningful insights from your data.
1. Identify Key Variables and Metrics
Identifying key variables and metrics is the first crucial step in conducting a comparative analysis. These are the factors or indicators you'll use to assess and compare your options.
- Relevance to Objectives: Ensure the chosen variables and metrics align closely with your analysis objectives. When comparing marketing strategies, relevant metrics might include customer acquisition cost, conversion rate, and retention.
- Quantitative vs. Qualitative: Decide whether your analysis will focus on quantitative data (numbers) or qualitative data (descriptive information). In some cases, a combination of both may be appropriate.
- Data Availability: Consider the availability of data. Ensure you can access reliable and up-to-date data for all selected variables and metrics.
- KPIs: Key Performance Indicators (KPIs) are often used as the primary metrics in comparative analysis. These are metrics that directly relate to your goals and objectives.
2. Visualize Data for Clarity
Data visualization techniques play a vital role in making complex information more accessible and understandable. Effective data visualization allows you to convey insights and patterns to stakeholders. Consider the following approaches:
- Charts and Graphs: Use various types of charts, such as bar charts, line graphs, and pie charts, to represent data. For example, a line graph can illustrate trends over time, while a bar chart can compare values across categories.
- Heatmaps: Heatmaps are particularly useful for visualizing large datasets and identifying patterns through color-coding. They can reveal correlations, concentrations, and outliers.
- Scatter Plots: Scatter plots help visualize relationships between two variables. They are especially useful for identifying trends, clusters, or outliers.
- Dashboards: Create interactive dashboards that allow users to explore data and customize views. Dashboards are valuable for ongoing analysis and reporting.
- Infographics: For presentations and reports, consider using infographics to summarize key findings in a visually engaging format.
Effective data visualization not only enhances understanding but also aids in decision-making by providing clear insights at a glance.
3. Establish Clear Comparative Frameworks
A well-structured comparative framework provides a systematic approach to your analysis. It ensures consistency and enables you to make meaningful comparisons. Here's how to create one:
- Comparison Matrices: Consider using matrices or spreadsheets to organize your data. Each row represents an option or entity, and each column corresponds to a variable or metric. This matrix format allows for side-by-side comparisons.
- Decision Trees: In complex decision-making scenarios, decision trees help map out possible outcomes based on different criteria and variables. They visualize the decision-making process.
- Scenario Analysis: Explore different scenarios by altering variables or criteria to understand how changes impact outcomes. Scenario analysis is valuable for risk assessment and planning.
- Checklists: Develop checklists or scoring sheets to systematically evaluate each option against predefined criteria. Checklists ensure that no essential factors are overlooked.
A well-structured comparative framework simplifies the analysis process, making it easier to draw meaningful conclusions and make informed decisions.
4. Evaluate and Score Criteria
Evaluating and scoring criteria is a critical step in comparative analysis, as it quantifies the performance of each option against the chosen criteria.
- Scoring System: Define a scoring system that assigns values to each criterion for every option. Common scoring systems include numerical scales, percentage scores, or qualitative ratings (e.g., high, medium, low).
- Consistency: Ensure consistency in scoring by defining clear guidelines for each score. Provide examples or descriptions to help evaluators understand what each score represents.
- Data Collection: Collect data or information relevant to each criterion for all options. This may involve quantitative data (e.g., sales figures) or qualitative data (e.g., customer feedback).
- Aggregation: Aggregate the scores for each option to obtain an overall evaluation. This can be done by summing the individual criterion scores or applying weighted averages.
- Normalization: If your criteria have different measurement scales or units, consider normalizing the scores to create a level playing field for comparison.
5. Assign Importance to Criteria
Not all criteria are equally important in a comparative analysis. Weighting criteria allows you to reflect their relative significance in the final decision-making process.
- Relative Importance: Assess the importance of each criterion in achieving your objectives. Criteria directly aligned with your goals may receive higher weights.
- Weighting Methods: Choose a weighting method that suits your analysis. Common methods include expert judgment, analytic hierarchy process (AHP), or data-driven approaches based on historical performance.
- Impact Analysis: Consider how changes in the weights assigned to criteria would affect the final outcome. This sensitivity analysis helps you understand the robustness of your decisions.
- Stakeholder Input: Involve relevant stakeholders or decision-makers in the weighting process. Their input can provide valuable insights and ensure alignment with organizational goals.
- Transparency: Clearly document the rationale behind the assigned weights to maintain transparency in your analysis.
By weighting criteria, you ensure that the most critical factors have a more significant influence on the final evaluation, aligning the analysis more closely with your objectives and priorities.
With these steps in place, you're well-prepared to conduct a comprehensive comparative analysis. The next phase involves interpreting your findings, drawing conclusions, and making informed decisions based on the insights you've gained.
Comparative Analysis Interpretation
Interpreting the results of your comparative analysis is a crucial phase that transforms data into actionable insights. We'll delve into various aspects of interpretation and how to make sense of your findings.
- Contextual Understanding: Before diving into the data, consider the broader context of your analysis. Understand the industry trends, market conditions, and any external factors that may have influenced your results.
- Drawing Conclusions: Summarize your findings clearly and concisely. Identify trends, patterns, and significant differences among the options or variables you've compared.
- Quantitative vs. Qualitative Analysis: Depending on the nature of your data and analysis, you may need to balance both quantitative and qualitative interpretations. Qualitative insights can provide context and nuance to quantitative findings.
- Comparative Visualization: Visual aids such as charts, graphs, and tables can help convey your conclusions effectively. Choose visual representations that align with the nature of your data and the key points you want to emphasize.
- Outliers and Anomalies: Identify and explain any outliers or anomalies in your data. Understanding these exceptions can provide valuable insights into unusual cases or factors affecting your analysis.
- Cross-Validation: Validate your conclusions by comparing them with external benchmarks, industry standards, or expert opinions. Cross-validation helps ensure the reliability of your findings.
- Implications for Decision-Making: Discuss how your analysis informs decision-making. Clearly articulate the practical implications of your findings and their relevance to your initial objectives.
- Actionable Insights: Emphasize actionable insights that can guide future strategies, policies, or actions. Make recommendations based on your analysis, highlighting the steps needed to capitalize on strengths or address weaknesses.
- Continuous Improvement: Encourage a culture of continuous improvement by using your analysis as a feedback mechanism. Suggest ways to monitor and adapt strategies over time based on evolving circumstances.
Comparative Analysis Applications
Comparative analysis is a versatile methodology that finds application in various fields and scenarios. Let's explore some of the most common and impactful applications.
Business Decision-Making
Comparative analysis is widely employed in business to inform strategic decisions and drive success. Key applications include:
Market Research and Competitive Analysis
- Objective: To assess market opportunities and evaluate competitors.
- Methods: Analyzing market trends, customer preferences, competitor strengths and weaknesses, and market share.
- Outcome: Informed product development, pricing strategies, and market entry decisions.
Product Comparison and Benchmarking
- Objective: To compare the performance and features of products or services.
- Methods: Evaluating product specifications, customer reviews, and pricing.
- Outcome: Identifying strengths and weaknesses, improving product quality, and setting competitive pricing.
Financial Analysis
- Objective: To evaluate financial performance and make investment decisions.
- Methods: Comparing financial statements, ratios, and performance indicators of companies.
- Outcome: Informed investment choices, risk assessment, and portfolio management.
Healthcare and Medical Research
In the healthcare and medical research fields, comparative analysis is instrumental in understanding diseases, treatment options, and healthcare systems.
Clinical Trials and Drug Development
- Objective: To compare the effectiveness of different treatments or drugs.
- Methods: Analyzing clinical trial data, patient outcomes, and side effects.
- Outcome: Informed decisions about drug approvals, treatment protocols, and patient care.
Health Outcomes Research
- Objective: To assess the impact of healthcare interventions.
- Methods: Comparing patient health outcomes before and after treatment or between different treatment approaches.
- Outcome: Improved healthcare guidelines, cost-effectiveness analysis, and patient care plans.
Healthcare Systems Evaluation
- Objective: To assess the performance of healthcare systems.
- Methods: Comparing healthcare delivery models, patient satisfaction, and healthcare costs.
- Outcome: Informed healthcare policy decisions, resource allocation, and system improvements.
Social Sciences and Policy Analysis
Comparative analysis is a fundamental tool in social sciences and policy analysis, aiding in understanding complex societal issues.
Educational Research
- Objective: To compare educational systems and practices.
- Methods: Analyzing student performance, curriculum effectiveness, and teaching methods.
- Outcome: Informed educational policies, curriculum development, and school improvement strategies.
Political Science
- Objective: To study political systems, elections, and governance.
- Methods: Comparing election outcomes, policy impacts, and government structures.
- Outcome: Insights into political behavior, policy effectiveness, and governance reforms.
Social Welfare and Poverty Analysis
- Objective: To evaluate the impact of social programs and policies.
- Methods: Comparing the well-being of individuals or communities with and without access to social assistance.
- Outcome: Informed policymaking, poverty reduction strategies, and social program improvements.
Environmental Science and Sustainability
Comparative analysis plays a pivotal role in understanding environmental issues and promoting sustainability.
Environmental Impact Assessment
- Objective: To assess the environmental consequences of projects or policies.
- Methods: Comparing ecological data, resource use, and pollution levels.
- Outcome: Informed environmental mitigation strategies, sustainable development plans, and regulatory decisions.
Climate Change Analysis
- Objective: To study climate patterns and their impacts.
- Methods: Comparing historical climate data, temperature trends, and greenhouse gas emissions.
- Outcome: Insights into climate change causes, adaptation strategies, and policy recommendations.
Ecosystem Health Assessment
- Objective: To evaluate the health and resilience of ecosystems.
- Methods: Comparing biodiversity, habitat conditions, and ecosystem services.
- Outcome: Conservation efforts, restoration plans, and ecological sustainability measures.
Technology and Innovation
Comparative analysis is crucial in the fast-paced world of technology and innovation.
Product Development and Innovation
- Objective: To assess the competitiveness and innovation potential of products or technologies.
- Methods: Comparing research and development investments, technology features, and market demand.
- Outcome: Informed innovation strategies, product roadmaps, and patent decisions.
User Experience and Usability Testing
- Objective: To evaluate the user-friendliness of software applications or digital products.
- Methods: Comparing user feedback, usability metrics, and user interface designs.
- Outcome: Improved user experiences, interface redesigns, and product enhancements.
Technology Adoption and Market Entry
- Objective: To analyze market readiness and risks for new technologies.
- Methods: Comparing market conditions, regulatory landscapes, and potential barriers.
- Outcome: Informed market entry strategies, risk assessments, and investment decisions.
These diverse applications of comparative analysis highlight its flexibility and importance in decision-making across various domains. Whether in business, healthcare, social sciences, environmental studies, or technology, comparative analysis empowers researchers and decision-makers to make informed choices and drive positive outcomes.
Comparative Analysis Best Practices
Successful comparative analysis relies on following best practices and avoiding common pitfalls. Implementing these practices enhances the effectiveness and reliability of your analysis.
- Clearly Defined Objectives: Start with well-defined objectives that outline what you aim to achieve through the analysis. Clear objectives provide focus and direction.
- Data Quality Assurance: Ensure data quality by validating, cleaning, and normalizing your data. Poor-quality data can lead to inaccurate conclusions.
- Transparent Methodologies: Clearly explain the methodologies and techniques you've used for analysis. Transparency builds trust and allows others to assess the validity of your approach.
- Consistent Criteria: Maintain consistency in your criteria and metrics across all options or variables. Inconsistent criteria can lead to biased results.
- Sensitivity Analysis: Conduct sensitivity analysis by varying key parameters, such as weights or assumptions, to assess the robustness of your conclusions.
- Stakeholder Involvement: Involve relevant stakeholders throughout the analysis process. Their input can provide valuable perspectives and ensure alignment with organizational goals.
- Critical Evaluation of Assumptions: Identify and critically evaluate any assumptions made during the analysis. Assumptions should be explicit and justifiable.
- Holistic View: Take a holistic view of the analysis by considering both short-term and long-term implications. Avoid focusing solely on immediate outcomes.
- Documentation: Maintain thorough documentation of your analysis, including data sources, calculations, and decision criteria. Documentation supports transparency and facilitates reproducibility.
- Continuous Learning: Stay updated with the latest analytical techniques, tools, and industry trends. Continuous learning helps you adapt your analysis to changing circumstances.
- Peer Review: Seek peer review or expert feedback on your analysis. External perspectives can identify blind spots and enhance the quality of your work.
- Ethical Considerations: Address ethical considerations, such as privacy and data protection, especially when dealing with sensitive or personal data.
By adhering to these best practices, you'll not only improve the rigor of your comparative analysis but also ensure that your findings are reliable, actionable, and aligned with your objectives.
Comparative Analysis Examples
To illustrate the practical application and benefits of comparative analysis, let's explore several real-world examples across different domains. These examples showcase how organizations and researchers leverage comparative analysis to make informed decisions, solve complex problems, and drive improvements:
Retail Industry - Price Competitiveness Analysis
Objective: A retail chain aims to assess its price competitiveness against competitors in the same market.
Methodology:
- Collect pricing data for a range of products offered by the retail chain and its competitors.
- Organize the data into a comparative framework, categorizing products by type and price range.
- Calculate price differentials, averages, and percentiles for each product category.
- Analyze the findings to identify areas where the retail chain's prices are higher or lower than competitors.
Outcome: The analysis reveals that the retail chain's prices are consistently lower in certain product categories but higher in others. This insight informs pricing strategies, allowing the retailer to adjust prices to remain competitive in the market.
Healthcare - Comparative Effectiveness Research
Objective: Researchers aim to compare the effectiveness of two different treatment methods for a specific medical condition.
Methodology:
- Recruit patients with the medical condition and randomly assign them to two treatment groups.
- Collect data on treatment outcomes, including symptom relief, side effects, and recovery times.
- Analyze the data using statistical methods to compare the treatment groups.
- Consider factors like patient demographics and baseline health status as potential confounding variables.
Outcome: The comparative analysis reveals that one treatment method is statistically more effective than the other in relieving symptoms and has fewer side effects. This information guides medical professionals in recommending the more effective treatment to patients.
Environmental Science - Carbon Emission Analysis
Objective: An environmental organization seeks to compare carbon emissions from various transportation modes in a metropolitan area.
Methodology:
- Collect data on the number of vehicles, their types (e.g., cars, buses, bicycles), and fuel consumption for each mode of transportation.
- Calculate the total carbon emissions for each mode based on fuel consumption and emission factors.
- Create visualizations such as bar charts and pie charts to represent the emissions from each transportation mode.
- Consider factors like travel distance, occupancy rates, and the availability of alternative fuels.
Outcome: The comparative analysis reveals that public transportation generates significantly lower carbon emissions per passenger mile compared to individual car travel. This information supports advocacy for increased public transit usage to reduce carbon footprint.
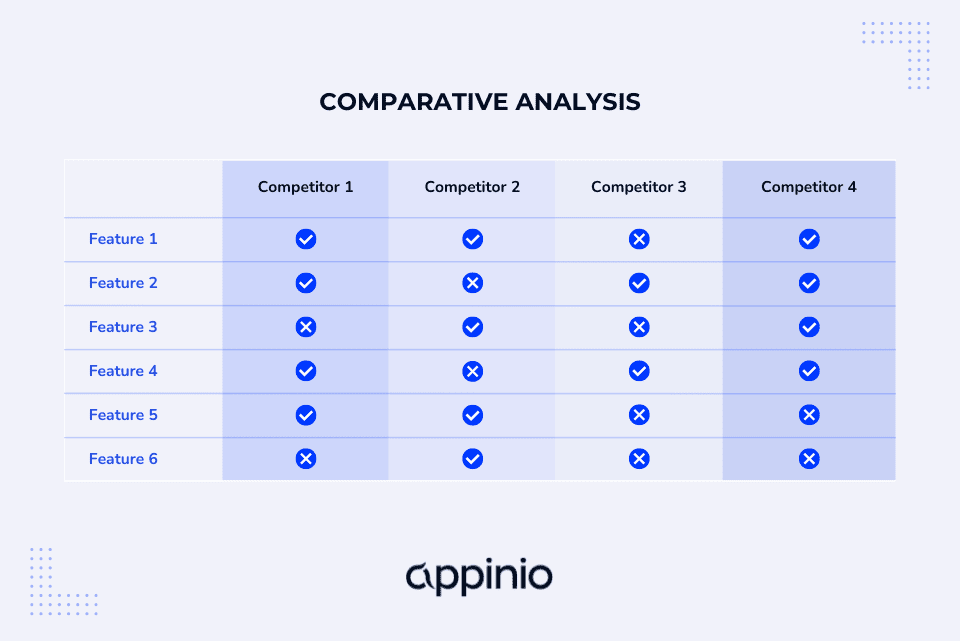
Technology Industry - Feature Comparison for Software Development Tools
Objective: A software development team needs to choose the most suitable development tool for an upcoming project.
Methodology:
- Create a list of essential features and capabilities required for the project.
- Research and compile information on available development tools in the market.
- Develop a comparative matrix or scoring system to evaluate each tool's features against the project requirements.
- Assign weights to features based on their importance to the project.
Outcome: The comparative analysis highlights that Tool A excels in essential features critical to the project, such as version control integration and debugging capabilities. The development team selects Tool A as the preferred choice for the project.
Educational Research - Comparative Study of Teaching Methods
Objective: A school district aims to improve student performance by comparing the effectiveness of traditional classroom teaching with online learning.
Methodology:
- Randomly assign students to two groups: one taught using traditional methods and the other through online courses.
- Administer pre- and post-course assessments to measure knowledge gain.
- Collect feedback from students and teachers on the learning experiences.
- Analyze assessment scores and feedback to compare the effectiveness and satisfaction levels of both teaching methods.
Outcome: The comparative analysis reveals that online learning leads to similar knowledge gains as traditional classroom teaching. However, students report higher satisfaction and flexibility with the online approach. The school district considers incorporating online elements into its curriculum.
These examples illustrate the diverse applications of comparative analysis across industries and research domains. Whether optimizing pricing strategies in retail, evaluating treatment effectiveness in healthcare, assessing environmental impacts, choosing the right software tool, or improving educational methods, comparative analysis empowers decision-makers with valuable insights for informed choices and positive outcomes.
Conclusion for Comparative Analysis
Comparative analysis is your compass in the world of decision-making. It helps you see the bigger picture, spot opportunities, and navigate challenges. By defining your objectives, gathering data, applying methodologies, and following best practices, you can harness the power of Comparative Analysis to make informed choices and drive positive outcomes.
Remember, Comparative analysis is not just a tool; it's a mindset that empowers you to transform data into insights and uncertainty into clarity. So, whether you're steering a business, conducting research, or facing life's choices, embrace Comparative Analysis as your trusted guide on the journey to better decisions. With it, you can chart your course, make impactful choices, and set sail toward success.
How to Conduct Comparative Analysis in Minutes?
Are you ready to revolutionize your approach to market research and comparative analysis? Appinio, a real-time market research platform, empowers you to harness the power of real-time consumer insights for swift, data-driven decisions. Here's why you should choose Appinio:
- Speedy Insights: Get from questions to insights in minutes, enabling you to conduct comparative analysis without delay.
- User-Friendly: No need for a PhD in research – our intuitive platform is designed for everyone, making it easy to collect and analyze data.
- Global Reach: With access to over 90 countries and the ability to define your target group from 1200+ characteristics, Appinio provides a worldwide perspective for your comparative analysis

