Appinio Research · 14.01.2025 · 29min read

Have you ever wondered how we can accurately estimate population parameters, like the average height of people in a city or the proportion of voters supporting a specific candidate, based on sample data? This is where confidence intervals come into play. Confidence intervals provide us with a range of plausible values for population parameters, along with a measure of how confident we are in those estimates. They help us quantify the uncertainty inherent in statistical analysis and make informed decisions in various fields, from scientific research to business and policy-making.
In this guide, we'll delve into confidence intervals, their importance, calculation methods, advanced techniques, and more. Whether you're a student, researcher, or professional seeking to understand and apply statistical concepts, this guide will equip you with the knowledge and tools to confidently estimate and interpret population parameters with precision and accuracy.
What is a Confidence Interval?
A confidence interval is a statistical tool used to estimate the range of values within which a population parameter, such as a population mean or proportion, is likely to lie. It provides a measure of uncertainty around a point estimate derived from sample data.
Confidence intervals are constructed based on sample statistics, such as the sample mean or proportion, and are typically accompanied by a specified confidence level, such as 95% or 99%. The confidence level indicates the probability that the calculated interval contains the true population parameter in repeated sampling.
Importance of Confidence Interval in Statistical Analysis
- Quantifying Uncertainty: Confidence intervals provide a measure of uncertainty around point estimates, allowing researchers to assess the reliability and precision of their findings. Confidence intervals help avoid overconfidence in statistical estimates by acknowledging and quantifying uncertainty.
- Inference and Decision-making: Confidence intervals play a crucial role in statistical inference and decision-making. They enable researchers to make inferences about population parameters based on sample data, guiding decisions in research, business, healthcare, and policy-making.
- Comparing Groups or Treatments: Confidence intervals facilitate comparisons between groups or treatments by providing a range of plausible values for population parameters. Whether comparing means, proportions, or other statistics, confidence intervals help assess the significance and magnitude of differences.
- Sample Size Determination: Confidence intervals inform sample size determination for research studies. By specifying the desired level of precision and confidence, researchers can calculate the sample size needed to achieve their study objectives while minimizing costs and resources.
- Communicating Results: Confidence intervals offer a concise way to communicate the precision and uncertainty of statistical estimates to stakeholders, including researchers, policymakers, and the general public. They provide a clear indication of the range within which the true population parameter is likely to fall.
- Robustness to Assumptions: Unlike point estimates, which can be sensitive to outliers or violations of distributional assumptions, confidence intervals are more robust and provide a more comprehensive picture of the underlying uncertainty. They offer a flexible approach to statistical analysis, particularly in situations where parametric assumptions may not hold.
- Quality Control and Process Improvement: In quality control and process improvement, confidence intervals are used to monitor and assess the performance of systems and processes. By tracking confidence intervals over time, organizations can identify trends, detect deviations from expected performance, and implement corrective actions as needed.
- Scientific Reproducibility: Confidence intervals contribute to the transparency and reproducibility of scientific research by quantifying the uncertainty inherent in statistical estimates. Replication studies can use confidence intervals to assess the consistency and generalizability of findings across different samples or settings.
- Decision-making under Uncertainty: In decision-making contexts, confidence intervals provide decision-makers with a framework for considering uncertainty and variability in their choices. Whether evaluating the effectiveness of interventions, assessing risks, or allocating resources, confidence intervals inform more informed and robust decisions.
Understanding Confidence Intervals
Confidence intervals are a cornerstone of statistical inference, allowing us to estimate population parameters with a certain degree of uncertainty. At its core, a confidence interval is a range of values derived from sample data that is likely to contain the true population parameter.
Imagine you're trying to estimate the average height of all adults in a country. Instead of relying solely on the sample mean height, which could vary from sample to sample, a confidence interval provides a range of plausible values within which the true population mean is expected to fall. This range is expressed with a specified level of confidence, typically 95% or 99%.
Interpretation of Confidence Interval
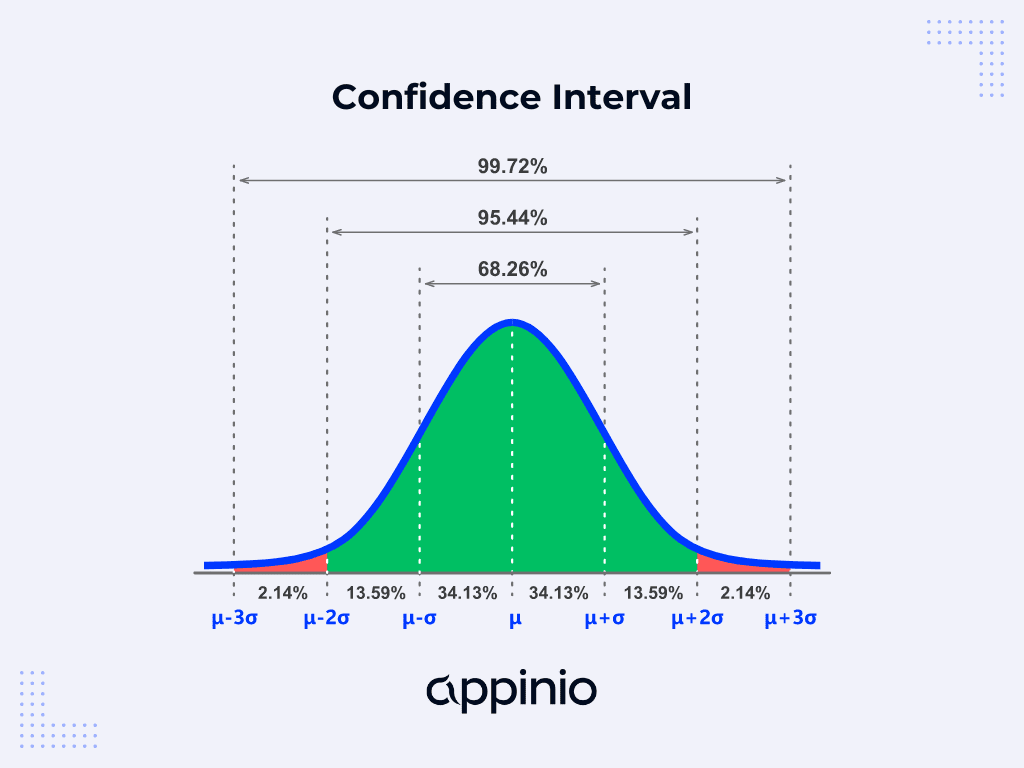
Interpreting a confidence interval involves understanding what the interval represents and what it does not. It's crucial to grasp that the confidence level associated with an interval refers to the percentage of confidence intervals, derived from repeated sampling, that would contain the true population parameter. For instance, if we construct 100 confidence intervals at a 95% confidence level, we would expect approximately 95 of them to contain the true population parameter.
When communicating the results of a confidence interval, it's crucial to emphasize that it provides a range of plausible values, not a specific point estimate. Furthermore, the confidence interval only quantifies the uncertainty due to sampling variability and does not account for other sources of uncertainty or bias.
How to Calculate Confidence Interval?
The calculation of a confidence interval depends on several factors, including the sample size, variability of the population, and the desired level of confidence. For normally distributed data with a known population standard deviation, the formula for calculating a confidence interval for the population mean (μ) is:
CI = x̄ ± Z(σ/√n)
Where:
- x̄ is the sample mean.
- σ is the population standard deviation.
- n is the sample size.
- Z is the critical value from the standard normal distribution corresponding to the desired confidence level.
For cases where the population standard deviation is unknown or the sample size is small, the t-distribution is used instead of the standard normal distribution. This adjustment accounts for the additional uncertainty introduced by estimating the population standard deviation from the sample data.
Automating your data collection and analysis processes with Appinio removes the need for manual calculations and streamlines your workflow. By leveraging our platform, you can generate confidence intervals effortlessly, saving time and ensuring accuracy in your statistical analyses. Say goodbye to tedious number crunching and hello to actionable insights at your fingertips.
Ready to revolutionize your research approach? Book a demo today and discover the power of Appinio firsthand!
How to Find Confidence Interval?
Confidence intervals are influenced by various factors that affect their width and precision. Understanding these factors is essential for accurately interpreting and constructing confidence intervals.
Sample Size
The sample size plays a crucial role in determining the precision of a confidence interval. Larger sample sizes generally result in narrower intervals and increased precision in estimating population parameters. This is because larger samples provide more information about the population, leading to more reliable estimates.
When the sample size is small, confidence intervals tend to be wider, reflecting the greater uncertainty associated with estimating population parameters from limited data. The standard error decreases as the sample size increases, resulting in narrower intervals.
For example, consider estimating the average income of households in a city. A larger sample size would provide a more representative sample of the population, leading to a narrower confidence interval and a more precise estimate of the population mean income.
Sample size is a critical factor in determining the precision of confidence intervals. With the Appinio Sample Size Calculator, you can ensure that your survey results are truly representative of the population you're studying. By inputting your desired margin of error, confidence level, and standard deviation, the calculator calculates the minimum sample size needed for reliable results.
With this powerful tool, you can confidently conduct surveys, knowing that your data accurately reflects the broader population.
Confidence Level
The confidence level determines the probability that the confidence interval will contain the true population parameter in repeated sampling. Commonly used confidence levels include 95% and 99%, although other levels can also be chosen based on the desired level of certainty.
A higher confidence level corresponds to a wider confidence interval, as it requires a greater degree of certainty that the interval contains the true parameter. For instance, a 99% confidence level results in a wider interval than a 95% confidence level, as it encompasses a larger range of values to accommodate the increased certainty.
Choosing the appropriate confidence level involves balancing the need for precision with the desired level of confidence in the estimate. While a higher confidence level provides greater certainty, it comes at the cost of wider intervals and potentially less precision in estimating the population parameter.
Population Variability
Population variability refers to the extent to which individual observations in the population differ from the population mean. Higher variability in the population leads to wider confidence intervals, as there is greater uncertainty in estimating the population parameter from the sample.
When the population variability is high, individual observations are more spread out around the population mean, making it more challenging to estimate the true parameter accurately from a sample. As a result, confidence intervals need to be wider to account for this increased uncertainty.
For example, consider estimating the average test scores of students in two schools. If one school has a broader range of test scores compared to the other, the confidence interval for the average test score in that school would be wider due to the higher population variability.
By considering the influence of factors such as sample size, confidence level, and population variability, researchers can construct confidence intervals that accurately reflect the uncertainty associated with estimating population parameters from sample data. This understanding enables informed decision-making and robust statistical inference.
Types of Confidence Intervals
Confidence intervals can be tailored to estimate various population parameters, each serving different analytical needs. Let's explore the different types of confidence intervals and how they are applied in statistical inference.
Confidence Interval for Population Mean
The confidence interval for the population mean is perhaps the most commonly used type of confidence interval. It provides an estimate of where the true population mean lies with a specified level of confidence.
Formula for Confidence Interval for Population Mean
The formula for calculating the confidence interval for the population mean (μ) is:
CI = x̄ ± Z(σ/√n)
Where:
- x̄ is the sample mean.
- σ is the population standard deviation.
- n is the sample size.
- Z is the critical value from the standard normal distribution corresponding to the desired confidence level.
Example:
Suppose we want to estimate the average time customers spend in a store. We collect a sample of 100 customers and find that the mean time spent is 30 minutes, with a standard deviation of 5 minutes. If we want to construct a 95% confidence interval for the population mean time spent, we can use the formula:
CI = 30 ± 1.96(5/√100)
CI = 30 ± 0.98
Thus, the 95% confidence interval for the population mean time spent by customers in the store is approximately 29.02 to 30.98 minutes.
Confidence Interval for Population Proportion
When dealing with categorical data, such as the proportion of individuals with a specific characteristic in a population, the confidence interval for population proportion is used.
Formula for Confidence Interval for Population Proportion
The formula for calculating the confidence interval for the population proportion (p) is:
CI = p̂ ± Z√[(p̂(1-p̂))/n]
Where:
- p̂ is the sample proportion.
- n is the sample size.
- Z is the critical value from the standard normal distribution corresponding to the desired confidence level.
Example:
Suppose we conduct a survey to estimate the proportion of adults in a city who own a smartphone. Out of a sample of 500 adults surveyed, 320 own a smartphone. To construct a 90% confidence interval for the population proportion of adults who own a smartphone, we can use the formula:
CI = 0.64 ± 1.645√[(0.64(1-0.64))/500]
CI = 0.64 ± 0.036
Thus, the 90% confidence interval for the population proportion of adults who own a smartphone is approximately 0.604 to 0.676.
Confidence Interval for Difference Between Means
When comparing two populations or groups, such as the effectiveness of two treatments, the confidence interval for the difference between means is used.
Formula for Confidence Interval for Difference Between Means
The formula for calculating the confidence interval for the difference between means (μ₁ - μ₂) is:
CI = (x̄₁ - x̄₂) ± Z√[(s₁²/n₁) + (s₂²/n₂)]
Where:
- x̄₁ and x̄₂ are the sample means of the two groups.
- s₁ and s₂ are the sample standard deviations of the two groups.
- n₁ and n₂ are the sample sizes of the two groups.
- Z is the critical value from the standard normal distribution corresponding to the desired confidence level.
Example:
Consider a study comparing the effectiveness of two weight loss programs. A sample of 50 participants is randomly assigned to each program, and their weight loss in pounds after six months is recorded. Let's say the sample mean weight loss for Program A is 12 pounds with a standard deviation of 3 pounds, while for Program B, it is 10 pounds with a standard deviation of 2 pounds. To construct a 99% confidence interval for the difference in mean weight loss between the two programs, we can use the formula:
CI = (12 - 10) ± 2.576√[(3²/50) + (2²/50)]
CI = 2 ± 1.63
Thus, the 99% confidence interval for the difference in mean weight loss between Program A and Program B is approximately 0.37 to 3.63 pounds.
Confidence Interval for Difference Between Proportions
Similarly, the confidence interval for the difference between proportions is used when comparing the proportions of two populations or groups, such as the success rates of two treatments.
Formula for Confidence Interval for Difference Between Proportions
The formula for calculating the confidence interval for the difference between proportions (p₁ - p₂) is:
CI = (p̂₁ - p̂₂) ± Z√[(p̂₁(1-p̂₁)/n₁) + (p̂₂(1-p̂₂)/n₂)]
Where:
- p̂₁ and p̂₂ are the sample proportions of the two groups.
- n₁ and n₂ are the sample sizes of the two groups.
- Z is the critical value from the standard normal distribution corresponding to the desired confidence level.
Example:
Suppose we conduct a clinical trial to compare the effectiveness of two medications in treating a particular condition. In Group 1, out of a sample of 200 patients, 140 show improvement. In Group 2, out of a sample of 250 patients, 150 show improvement. To construct a 95% confidence interval for the difference in proportions of patients showing improvement between the two groups, we can use the formula:
CI = [(140/200) - (150/250)] ± 1.96√[((140/200)(1-(140/200))/200) + ((150/250)(1-(150/250))/250)]
CI = (0.70 - 0.60) ± 0.087
Thus, the 95% confidence interval for the difference in proportions of patients showing improvement between the two groups is approximately 0.01 to 0.19.
By understanding the different types of confidence intervals and their respective formulas, researchers can effectively analyze and compare data from various populations or groups, leading to informed decision-making and robust statistical inference.
How to Construct a Confidence Interval?
Calculating confidence intervals requires careful consideration of various factors, from sample size to the choice of statistical method. Here are some practical tips to help you calculate confidence intervals accurately.
- Understand Your Data: Before calculating confidence intervals, thoroughly understand your data and study population. Consider factors such as data distribution, sample size, and the nature of the population.
- Choose the Right Formula: Select the appropriate formula for calculating confidence intervals based on the characteristics of your data, such as sample size and whether the population standard deviation is known.
- Verify Assumptions: Check the validity of assumptions underlying the calculation of confidence intervals, such as the normality of data and the independence of observations. Violating these assumptions can lead to inaccurate results.
- Use Software or Online Calculators: While it's essential to understand the underlying principles of calculating confidence intervals, using software or online calculators can streamline the process and reduce the likelihood of computational errors.
- Check for Outliers: Outliers can significantly affect the results of confidence intervals. Before calculating intervals, check for outliers and consider whether they should be removed or addressed in the analysis.
- Interpret Results with Caution: When interpreting confidence intervals, remember that they provide estimates with a certain level of uncertainty. Avoid overinterpreting narrow intervals or drawing definitive conclusions based solely on interval boundaries.
- Consider Practical Significance: In addition to statistical significance, consider the practical significance of your results. A statistically significant difference may not always be practically significant. Take into account the context and implications of your findings.
Confidence Interval Applications
Confidence intervals are not merely theoretical constructs; they have practical applications in various fields, from healthcare to finance, research, and more.
Real-World Examples of Using Confidence Intervals
- Medical Research: In clinical trials, confidence intervals are used to estimate the effectiveness of new treatments compared to existing ones. For instance, researchers might use confidence intervals to determine whether a new medication leads to a significant reduction in symptoms compared to a placebo or standard treatment.
- Market Research: Companies often conduct surveys to gather insights into consumer preferences and behaviors. Confidence intervals help estimate parameters such as customer satisfaction levels or market share, providing actionable insights for marketing strategies and product development.
- Economic Analysis: Economists use confidence intervals to estimate key economic indicators, such as unemployment rates or inflation levels. These estimates guide policymakers in making decisions related to monetary policy and economic stimulus measures.
- Quality Control: Manufacturers use confidence intervals to monitor the quality of their products and processes. For example, a production manager might use confidence intervals to estimate the defect rate in a manufacturing process and make adjustments to improve product quality.
- Environmental Science: Environmental scientists use confidence intervals to estimate population parameters related to environmental factors, such as air quality or water pollution levels. These estimates inform policymakers and regulatory agencies in implementing measures to protect public health and the environment.
Importance of Confidence Intervals in Research and Decision-Making
- Quantifying Uncertainty: Confidence intervals provide a measure of uncertainty around sample estimates, allowing researchers and decision-makers to assess the reliability of their findings. Stakeholders can make more informed decisions by acknowledging the inherent uncertainty in statistical estimates.
- Comparing Groups or Interventions: Confidence intervals facilitate comparisons between groups or interventions by providing a range of plausible values for population parameters. Whether comparing treatment outcomes in healthcare or evaluating the effectiveness of marketing campaigns, confidence intervals enable researchers to draw meaningful comparisons.
- Sample Size Determination: Confidence intervals are crucial in determining the sample size for research studies. By specifying the desired level of precision and confidence, researchers can calculate the sample size needed to achieve their study objectives while minimizing costs and resources.
- Risk Assessment: In decision-making contexts, confidence intervals help assess the risk associated with different options or scenarios. For example, in financial risk management, confidence intervals are used to estimate the range of potential returns or losses on investment portfolios, allowing investors to make informed decisions.
- Policy-making and Planning: Policymakers rely on confidence intervals to inform policy decisions and strategic planning. Whether setting targets for public health initiatives or allocating resources for infrastructure projects, confidence intervals provide policymakers with a framework for considering uncertainty and variability in their decision-making processes.
By incorporating confidence intervals into research and decision-making processes, stakeholders can enhance the validity and reliability of their analyses, leading to more informed and effective outcomes.
Confidence Intervals Challenges
Confidence intervals are powerful tools, but they can be prone to various mistakes and pitfalls if not used correctly. Being aware of these common errors can help ensure the accuracy and reliability of your analyses. Here are some common challenges to watch out for.
- Misinterpreting Confidence Level: One common mistake is misinterpreting the confidence level. A 95% confidence level does not mean that there is a 95% chance that the true parameter falls within the interval. Instead, it means that if the sampling process were repeated many times, 95% of the resulting intervals would contain the true parameter.
- Ignoring Assumptions: Confidence intervals rely on certain assumptions, such as the normality of data or independence of observations. Ignoring these assumptions can lead to inaccurate results. It's essential to check the validity of assumptions before applying confidence intervals.
- Small Sample Sizes: Confidence intervals become less reliable with smaller sample sizes. Small samples can lead to wider intervals and less precise estimates of population parameters. Be cautious when interpreting confidence intervals from small samples, and consider increasing the sample size if possible.
- Non-Representative Samples: Using non-representative samples can bias confidence intervals. Ensure that your sample is representative of the population of interest to obtain accurate estimates. Biased samples can result in confidence intervals that do not reflect the true population parameter.
- Incorrect Formula Selection: Different scenarios require different formulas for calculating confidence intervals. Using the wrong formula, such as using the z-test instead of the t-test for small sample sizes, can lead to incorrect intervals. Always choose the appropriate formula based on the characteristics of your data.
- Confusing Precision with Accuracy: A narrower confidence interval does not necessarily indicate greater accuracy. It reflects greater precision in estimating the parameter but does not guarantee that the estimate is accurate. Consider both precision and accuracy when interpreting confidence intervals.
- Multiple Comparisons: Conducting multiple comparisons without adjusting for multiplicity can inflate the overall Type I error rate. Be cautious when interpreting confidence intervals from multiple comparisons and consider adjusting for multiplicity using methods such as Bonferroni correction.
Advanced Topics in Confidence Interval
Confidence intervals extend beyond traditional methods like the z-test or t-test. Advanced techniques offer more flexibility and robustness in estimating population parameters. Let's explore some of these advanced topics in confidence interval estimation.
Bootstrap Method for Calculating Confidence Intervals
The bootstrap method is a resampling technique that provides an alternative approach to calculating confidence intervals, especially when the underlying assumptions of parametric methods are violated. Instead of relying on theoretical distributions, bootstrap resampling generates multiple samples from the observed data to empirically estimate the sampling distribution of a statistic.
Procedure for Bootstrap Method:
- Resampling: Generate a large number of bootstrap samples by randomly sampling with replacement from the observed data.
- Calculate Statistic: For each bootstrap sample, calculate the statistic of interest (e.g., mean, median, proportion).
- Estimate Distribution: Construct the sampling distribution of the statistic based on the bootstrap replicates.
- Calculate Confidence Interval: Determine the confidence interval by obtaining the appropriate percentile range from the sampling distribution.
Advantages of the Bootstrap Method:
- Distribution-Free: The bootstrap method does not rely on assumptions about the underlying distribution of the data, making it suitable for non-parametric or complex data structures.
- Flexibility: Bootstrap can be applied to a wide range of statistical estimators and hypothesis tests, offering flexibility in analysis.
- Robustness: Bootstrap confidence intervals are robust to violations of normality and other assumptions, providing more reliable estimates in real-world scenarios.
Bayesian Approach to Confidence Intervals
In Bayesian statistics, confidence intervals are replaced with credible intervals, reflecting the uncertainty in parameter estimates from a Bayesian perspective. Unlike frequentist confidence intervals, which provide a range of plausible values based on sampling variability, Bayesian credible intervals incorporate prior information and update beliefs based on observed data using Bayes' theorem.
Procedure for Bayesian Approach:
- Specify Prior Distribution: Define a prior distribution representing existing knowledge or beliefs about the parameter of interest before observing the data.
- Update with Data: Use Bayes' theorem to update the prior distribution based on the likelihood function of the observed data, resulting in the posterior distribution.
- Construct Credible Interval: Obtain the credible interval by selecting the region of the posterior distribution that contains a specified probability mass (e.g., 95%).
Advantages of the Bayesian Approach:
- Incorporation of Prior Information: Bayesian credible intervals allow for the incorporation of prior beliefs or expert knowledge about the parameter, leading to more informative inference.
- Flexibility: Bayesian methods can handle complex models and hierarchical structures, making them suitable for a wide range of statistical problems.
- Probabilistic Interpretation: Credible intervals have a straightforward probabilistic interpretation, representing the uncertainty in parameter estimates given the observed data and prior information.
Non-parametric Methods
Non-parametric methods provide alternatives to traditional parametric approaches by making fewer assumptions about the underlying distribution of the data. These methods are particularly useful when dealing with data that do not follow a specific distribution or when the sample size is small.
Examples of Non-parametric Methods:
- Bootstrap Method: As mentioned earlier, the bootstrap method is a versatile non-parametric technique for estimating confidence intervals without assuming a particular distribution.
- Rank-Based Methods: Rank-based procedures, such as the Wilcoxon rank-sum test or the Mann-Whitney U test, use the ranks of observations rather than the actual data values, making them robust to non-normality and outliers.
- Permutation Tests: Permutation tests randomly reassign observations between groups to generate a null distribution, allowing for hypothesis testing and confidence interval estimation without assuming any specific distribution.
Non-parametric methods offer flexibility and robustness in situations where parametric assumptions are violated or when dealing with complex data structures. By leveraging these advanced techniques, researchers can obtain more reliable and informative confidence intervals for their analyses.
Conclusion for Confidence Intervals
Confidence intervals serve as invaluable tools in statistical analysis, allowing us to estimate population parameters with precision and assess the uncertainty surrounding our estimates. By providing a range of plausible values along with a measure of confidence, confidence intervals enable researchers, decision-makers, and practitioners to make informed decisions based on empirical evidence. Whether determining the effectiveness of a new treatment, estimating market trends, or assessing the impact of policy interventions, confidence intervals offer a reliable framework for drawing conclusions from sample data and guiding actions with confidence.
As you continue to apply confidence intervals in your own work, remember the importance of understanding the underlying assumptions, choosing appropriate calculation methods, and interpreting results with caution. By incorporating best practices and leveraging advanced techniques when necessary, you can harness the power of confidence intervals to generate meaningful insights, support evidence-based decision-making, and contribute to advancements in your field.
How to Conduct Research in Minutes?
Introducing Appinio, the real-time market research platform revolutionizing how companies gather consumer insights. With Appinio, conducting your own market research is a breeze. Say goodbye to lengthy data collection processes and hello to instant insights.
Here's why Appinio is your go-to solution for fast and reliable market research:
- From Questions to Insights in Minutes: With our platform, you can go from formulating your research questions to obtaining actionable insights in just minutes. No more waiting days or weeks for results.
- Intuitive Platform for Everyone: You don't need a PhD in research to use Appinio. Our platform is designed to be intuitive and user-friendly, ensuring that anyone can easily navigate it and conduct research like a pro.
- Rapid Turnaround Time: Need answers fast? With an average field time of less than 23 minutes for 1,000 respondents, Appinio delivers results swiftly, empowering you to make informed decisions in record time.

