Appinio Research · 30.04.2026 · 31min read
Have you ever wondered how companies know exactly where to position their products in the market to attract customers? Understanding consumer perceptions is key, and that's where perceptual mapping comes in. It's like a map that shows how consumers view different brands or products based on specific attributes.
This guide will walk you through everything you need to know about perceptual mapping, from its definition and purpose to practical applications and best practices. Whether you're a marketer looking to gain insights into consumer behavior or a business owner seeking to better understand your competitive landscape, perceptual mapping can provide valuable insights to inform your strategic decision-making.
What is Perceptual Mapping?
Perceptual mapping is a strategic tool used in marketing to visually represent how consumers perceive brands, products, or services relative to each other. Perceptual mapping provides marketers with insights into consumer perceptions and preferences, allowing them to identify market opportunities, assess competitive positioning, and develop targeted marketing strategies.
Perceptual maps are typically created by plotting brands or products on a graph based on their perceived attributes or characteristics. The resulting map provides a visual representation of the competitive landscape, with brands/products positioned relative to each other based on how consumers perceive them.
Brief History of Perceptual Mapping
The concept of perceptual mapping can be traced back to the 1960s when marketing researchers began exploring methods to visually represent consumer perceptions. Early pioneers such as Wendell R. Smith and Harry Beckwith laid the groundwork for perceptual mapping, which has since evolved with technological advancements and data analysis techniques.
Over the years, perceptual mapping has become a standard tool in marketing research and strategy development, helping companies gain a deeper understanding of consumer behavior and market dynamics.
Importance of Perceptual Mapping in Marketing Strategy
- Market Segmentation: Perceptual mapping helps marketers identify distinct market segments based on consumer perceptions and preferences, allowing for targeted marketing strategies tailored to specific customer needs.
- Competitive Analysis: By visually representing the competitive landscape, perceptual mapping enables marketers to assess how their brands/products are positioned relative to competitors, identify strengths and weaknesses, and develop strategies to differentiate themselves in the market.
- Product Positioning: Perceptual mapping informs product positioning strategies by highlighting areas of opportunity and differentiation. Marketers can use perceptual maps to identify gaps in the market and position their offerings in a way that resonates with target consumers.
- Strategic Decision-Making: Perceptual mapping provides valuable insights that inform strategic decision-making across various aspects of marketing, including new product development, brand repositioning, marketing communication strategies, and pricing strategies. Marketers can make informed decisions that drive business growth and success by understanding consumer perceptions and preferences.
Understanding Perceptual Mapping
Perceptual mapping serves as a cornerstone in understanding consumer behavior and market dynamics. By visually representing consumer perceptions, it provides marketers with actionable insights to drive strategic decisions.
Conceptual Framework
At the heart of perceptual mapping lies the concept of how consumers perceive and evaluate brands or products based on specific attributes. This framework acknowledges that various factors influence consumer preferences, including quality, price, brand image, and functionality. Understanding this framework allows marketers to dissect the underlying drivers of consumer behavior and strategically position their offerings in the market landscape.
Perceptual Map Components
The efficacy of perceptual mapping hinges on three fundamental components:
- Attributes: These are the distinguishing characteristics or features that consumers associate with brands or products. Attributes can range from tangible aspects like price and quality to more abstract concepts like brand reputation and sustainability.
- Brands/Products: The entities under examination, positioned on the perceptual map based on how consumers perceive them relative to each other. These can include competing brands within a specific product category or variations of a single brand/product.
- Consumer Perceptions: The subjective evaluations and preferences of consumers regarding different brands/products and their associated attributes. These perceptions drive purchasing decisions and shape brand loyalty.
Types of Perceptual Maps
Perceptual maps come in various forms, each offering unique insights into consumer perceptions:
- Two-Dimensional Maps: These maps plot brands/products along two axes, typically representing opposing attributes such as price versus quality or luxury versus affordability. Two-dimensional maps provide a simplified yet insightful visualization of market dynamics.
- Three-Dimensional Maps: Adding an extra dimension to the mapping process introduces another layer of complexity and depth. Three-dimensional maps allow for the exploration of additional attributes or factors, offering a more nuanced understanding of consumer preferences.
- Multidimensional Maps: As the name suggests, multidimensional maps incorporate multiple attributes to paint a comprehensive picture of consumer perceptions. These maps are especially useful for industries with intricate product offerings or diverse consumer segments, providing marketers with detailed insights for strategic decision-making.
Data Collection and Analysis Techniques
Accurate data collection and robust analysis are critical for the success of perceptual mapping initiatives. Marketers employ various techniques to gather and interpret data, including:
- Surveys: Structured questionnaires designed to elicit consumer opinions and preferences regarding different brands/products and their associated attributes. Surveys can be conducted online, via phone interviews, or in-person focus groups.
- Interviews: In-depth interviews offer a qualitative approach to understanding consumer perceptions, allowing marketers to delve deeper into underlying motivations and preferences.
- Observational Research: Direct observation of consumer behavior in real-world settings provides valuable insights into how consumers interact with brands/products and make purchasing decisions.
Once data is collected, statistical analysis techniques such as multidimensional scaling (MDS) or factor analysis are employed to analyze the data and derive meaningful insights. MDS, for example, transforms consumer similarity or dissimilarity judgments into spatial representations, facilitating the creation of perceptual maps that accurately reflect consumer perceptions. Similarly, factor analysis helps identify underlying dimensions or factors that drive consumer perceptions, informing the selection of attributes for perceptual mapping.
Harnessing the power of Appinio for data collection can streamline the perceptual mapping process, ensuring that you have access to real-time consumer insights to inform strategic decision-making. With Appinio's intuitive platform, you can seamlessly conduct surveys, interviews, and observational research to gather comprehensive data on consumer perceptions and preferences. Whether you're exploring attribute evaluations or delving into brand perceptions, Appinio empowers you to collect actionable data efficiently and effectively.
Ready to elevate your perceptual mapping initiatives with Appinio? Book a demo today and discover how you can unlock valuable insights to drive business success!
Benefits of Perceptual Mapping
Perceptual mapping offers a multitude of advantages for marketers seeking to gain deeper insights into consumer behavior and market dynamics. Let's explore how perceptual mapping can be leveraged to unlock key benefits across various aspects of marketing strategy.
Market Segmentation
Market segmentation is the process of dividing a heterogeneous market into distinct groups of consumers with similar needs, preferences, or behaviors. Perceptual mapping plays a pivotal role in this process by identifying clusters of consumer perceptions and preferences, which can then be used to define meaningful market segments. By understanding each segment's unique characteristics and preferences, marketers can tailor their products, messaging, and marketing strategies to better meet the needs of target consumers.
For example, consider a cosmetics company using perceptual mapping to segment the market based on attributes such as price sensitivity, product quality, and brand perception. By identifying distinct segments of consumers with varying preferences and attitudes towards these attributes, the company can develop targeted marketing campaigns and product offerings tailored to each segment's specific needs and preferences.
Competitive Analysis
Perceptual mapping provides marketers with valuable insights into how their brands or products are positioned relative to competitors. By plotting competing brands/products on the same perceptual map, marketers can visually assess their competitive landscape and identify areas of strength and weakness. This comparative analysis allows marketers to benchmark their offerings against competitors, identify opportunities for differentiation, and develop strategies to gain a competitive edge.
For instance, a perceptual map in the fast-food industry may reveal that while a company's burger offering is perceived as high-quality, it is also positioned at a higher price point compared to competitors. Armed with this insight, the company can adjust its pricing strategy or emphasize other attributes to better align with consumer preferences and gain a competitive advantage.
Product Positioning
Effective product positioning is essential for creating a distinct and favorable image in consumers' minds. Perceptual mapping enables marketers to strategically position their products relative to competitors based on consumer perceptions and preferences. By analyzing the perceptual map, marketers can identify unique positioning opportunities and develop strategies to differentiate their offerings in the market.
For example, a luxury car manufacturer may use perceptual mapping to identify a gap in the market for environmentally friendly luxury vehicles. By positioning its hybrid or electric models in this space, the company can appeal to environmentally conscious consumers while maintaining its premium brand image.
Identifying Market Gaps
Perceptual mapping helps marketers identify underserved or overlooked market segments, as well as areas where competitors may be failing to meet consumer needs. By analyzing the perceptual map, marketers can identify gaps in the market where there is unmet demand or competitors are not effectively addressing consumer preferences. This insight allows marketers to capitalize on opportunities for innovation and develop new products or services that fill these gaps.
For instance, a clothing retailer may use perceptual mapping to identify a segment of consumers who value sustainable fashion but find existing offerings lacking in terms of style and affordability. By launching a new line of sustainably sourced and fashion-forward clothing at competitive prices, the retailer can capitalize on this market gap and attract environmentally conscious consumers willing to pay for stylish and eco-friendly apparel.
How to Create a Perceptual Map?
Creating a perceptual map is a systematic process that involves several key steps to ensure accuracy, relevance, and actionable insights. Let's walk through each step to guide you through the process of creating a perceptual map effectively.
1. Define Objectives and Scope
Before embarking on the perceptual mapping journey, it's essential to define the objectives and scope of the project clearly. Determine what specific insights you aim to gain from the perceptual map and how it will inform your marketing strategy. Consider questions such as:
- What are the primary goals of the perceptual mapping exercise?
- Which market segment or target audience will the perceptual map focus on?
- What attributes or dimensions will be included in the analysis?
- How will the insights from the perceptual map be used to drive strategic decisions?
By defining clear objectives and scope upfront, you can ensure that the perceptual map aligns with your broader business goals and delivers actionable insights that drive results.
2. Select Relevant Attributes
Selecting the right attributes is crucial for accurately capturing consumer perceptions and preferences. Identify the key dimensions or attributes relevant to your product category or industry. These attributes should be meaningful to consumers and differentiate between competing brands or products. Consider both tangible and intangible attributes that influence consumer decision-making, such as:
- Price
- Quality
- Brand reputation
- Features and functionality
- Design or aesthetics
- Environmental sustainability
- Customer service
Choose attributes that are distinct enough to provide meaningful differentiation between brands/products but not so numerous that they overwhelm the analysis.
3. Choose Brands/Products for Comparison
Once you've identified the relevant attributes, select the brands or products that will be compared on the perceptual map. Choose competitors or offerings that are representative of the market landscape and cover a range of positioning strategies. Consider both direct competitors and alternative options that consumers may consider when making purchasing decisions.
Ensure that the brands/products chosen reflect the diversity of consumer preferences and cover a spectrum of attributes relevant to the perceptual mapping exercise.
4. Collect Data
Data collection is a critical step in the perceptual mapping process, as it forms the foundation for the analysis and construction of the perceptual map. There are several methods for collecting data, including surveys, interviews, and observational research.
- Use a mix of quantitative and qualitative methods to gather comprehensive insights into consumer perceptions.
- Ensure that the survey questions or interview prompts are clear, concise, and relevant to the attributes being measured.
- Collect data from a representative sample of your target audience to ensure that the perceptual map accurately reflects consumer preferences.
5. Analyze and Interpret Data
Once the data has been collected, it's time to analyze and interpret the findings. Use statistical analysis techniques such as multidimensional scaling (MDS) or factor analysis to transform the raw data into a visual representation of consumer perceptions. Interpret the results to identify patterns, clusters, and relationships between brands/products and attributes.
- Look for patterns or clusters of brands/products on the perceptual map that indicate commonalities in consumer perceptions.
- Identify areas of convergence or divergence between competing brands/products, as well as outliers that may represent unique positioning strategies.
- When interpreting the results, consider the context of the market and consumer preferences, taking into account factors such as industry trends, competitor actions, and socio-economic factors.
6. Construct the Perceptual Map
With the data analyzed and interpreted, it's time to construct the perceptual map. Plot the brands/products on the map based on their perceived attributes, using clear labels and symbols to make the map easy to understand and interpret.
- Choose an appropriate scaling method and visualization technique based on the analysis and interpretation of the data.
- Ensure that the map's axes accurately represent the attributes being measured and provide meaningful insights into consumer perceptions.
- Use color coding or shading to differentiate between brands/products or highlight specific areas of interest on the map.
7. Refine and Validate the Map
Once the perceptual map is constructed, it must be refined and validated to ensure its accuracy and relevance.
- Review the map to ensure it accurately reflects the data and insights gained from the analysis.
- Seek feedback from stakeholders or subject matter experts to validate the map's interpretation and relevance.
- Conduct additional research or analysis to address any gaps or uncertainties in the data or mapping process.
By refining and validating the perceptual map, you can ensure that it provides actionable insights that drive informed decision-making and strategic planning.
Perceptual Mapping Applications
Perceptual mapping offers a myriad of practical applications across various aspects of marketing strategy, providing valuable insights to drive decision-making and enhance market effectiveness. Let's explore some practical applications of perceptual mapping.
New Product Development
Perceptual mapping plays a pivotal role in guiding new product development initiatives by providing insights into consumer preferences, market gaps, and competitive positioning. By analyzing consumer perceptions and identifying unmet needs or underserved market segments, marketers can develop new products aligned with market demand and differentiated from existing offerings.
For example, a technology company may use perceptual mapping to identify emerging trends and consumer preferences in the smartphone market. By analyzing the perceptual map, the company can identify opportunities for innovation, such as developing a smartphone with advanced camera features targeted at photography enthusiasts or a budget-friendly option for price-sensitive consumers.
Brand Repositioning
Perceptual mapping enables marketers to assess their brand's current positioning relative to competitors and identify opportunities for repositioning to better align with consumer preferences or changing market dynamics. By analyzing the perceptual map, marketers can identify areas where their brand may be perceived differently than intended and develop strategies to strengthen their brand image and competitive advantage.
For instance, a luxury fashion brand may use perceptual mapping to assess how it is perceived relative to competitors in terms of quality, exclusivity, and affordability. Suppose the perceptual map reveals that the brand is perceived as less exclusive than desired. In that case, the company may implement strategies to reinforce its luxury image through selective distribution, premium pricing, and exclusive collaborations.
Marketing Communication Strategies
Perceptual mapping provides valuable insights for developing targeted marketing communication strategies that resonate with target audiences and differentiate brands/products from competitors. By understanding how consumers perceive different brands/products and their associated attributes, marketers can tailor their messaging, advertising, and promotional efforts to highlight key selling points and address consumer needs and preferences.
For example, a beverage company may use perceptual mapping to identify key attributes that drive consumer preferences in the market, such as taste, healthiness, and convenience. Based on the insights from the perceptual map, the company can develop marketing communication strategies that emphasize the natural ingredients, health benefits, and convenience of its products to appeal to health-conscious consumers seeking nutritious beverage options.
Pricing Strategies
Perceptual mapping can inform pricing strategies by providing insights into how consumers perceive the value of different brands/products relative to their price points. By analyzing the perceptual map, marketers can identify price-quality relationships and opportunities to optimize pricing strategies to maximize profitability and market share.
For example, a consumer electronics company may use perceptual mapping to assess how its products are positioned relative to competitors in terms of attributes such as performance, features, and price. Suppose the perceptual map reveals that the company's products are perceived as offering superior performance but at a higher price point than competitors. In that case, the company may consider implementing value-based pricing strategies, such as bundling high-value features with lower-priced models or offering discounts to price-sensitive segments.
Perceptual Mapping Examples
To better understand how perceptual mapping works in real-world scenarios, let's explore some examples across different industries:
Example 1: Automobile Industry
In the automobile industry, perceptual mapping can help manufacturers understand how consumers perceive different car brands based on price, reliability, and luxury. For instance, a perceptual map may reveal that consumers perceive BMW as a high-priced luxury brand known for performance, while Toyota is seen as a more affordable and reliable option. By analyzing the perceptual map, automakers can identify opportunities to differentiate their brands and tailor their marketing strategies to target specific consumer segments effectively.
Example 2: Fast Food Industry
Perceptual mapping is also widely used in the fast-food industry to assess consumer perceptions of different restaurant chains based on attributes such as taste, value, and convenience. For example, a perceptual map may show that consumers perceive McDonald's as offering affordable and convenient fast food, while Chipotle is seen as providing higher-quality and healthier options at a slightly higher price point. By analyzing the perceptual map, fast food chains can identify areas for improvement and develop strategies to better meet consumer needs and preferences.
Example 3: Consumer Electronics Industry
In the consumer electronics industry, perceptual mapping can help companies understand how consumers perceive competing brands and products based on attributes such as innovation, design, and price. For instance, a perceptual map may show that consumers perceive Apple as a premium brand known for innovative products with sleek design, while Samsung is seen as offering a more comprehensive range of products at various price points. By analyzing the perceptual map, electronics companies can identify areas of differentiation and develop marketing strategies to appeal to target consumer segments effectively.
These examples illustrate how perceptual mapping can provide valuable insights into consumer perceptions and preferences across different industries. By leveraging perceptual mapping techniques, companies can make informed decisions that drive business growth and success.
Perceptual Mapping Tools and Software
Choosing the right tools and software is crucial for effectively creating and analyzing perceptual maps. Let's explore various options available for conducting perceptual mapping, ranging from commercial software solutions to free and open-source alternatives, as well as do-it-yourself (DIY) approaches using Excel templates.
Commercial Software Solutions
Commercial software solutions offer advanced features and functionalities for conducting perceptual mapping, making them popular choices among marketers and market researchers. Here are some notable options:
- SPSS (Statistical Package for the Social Sciences): Widely used for data analysis, SPSS offers powerful capabilities for conducting multidimensional scaling (MDS) and generating perceptual maps from survey data. Its user-friendly interface and robust statistical tools make it a preferred choice for researchers conducting perceptual mapping studies.
- Looker Studio: Looker Studio (formerly Google Data Studio) is a comprehensive data analytics platform that enables users to create dynamic and interactive perceptual maps. With its intuitive interface and customizable visualization options, Looker Studio empowers marketers to gain valuable insights into consumer perceptions and preferences.
- Microsoft Power BI: Microsoft Power BI is a leading business intelligence tool that allows users to create visually stunning perceptual maps and dashboards. With its seamless integration with Microsoft products and extensive data visualization capabilities, Power BI enables marketers to analyze and interpret data effectively.
- Appinio: Appinio is a real-time market research platform that provides users with actionable consumer insights to inform strategic decision-making. With its intuitive interface and robust data collection capabilities, Appinio streamlines the process of gathering consumer feedback, allowing marketers to conduct perceptual mapping studies with ease.
Free and Open-Source Options
Free and open-source software solutions offer viable alternatives for those on a budget or seeking more flexibility and customization options. Here are some popular choices:
- R: R is an open-source statistical programming language widely used for data analysis and visualization. With its extensive library of packages, including those for multidimensional scaling (MDS) and perceptual mapping, R provides marketers with the flexibility and control to create customized perceptual maps tailored to their specific needs.
- Python: Python is a versatile programming language known for its simplicity and readability. With libraries such as Matplotlib and Seaborn, Python offers powerful data visualization and analysis tools, making it well-suited for creating perceptual maps from survey data or other sources.
Excel Templates and DIY Approaches
For those comfortable with Excel and looking for a more hands-on approach, Excel templates, and do-it-yourself (DIY) methods provide simple yet effective ways to create perceptual maps. To create a perceptual map using Excel:
- Data Preparation: Organize your data in Excel, with rows representing respondents and columns representing attributes. Ensure that your data is clean and formatted correctly for analysis.
- Data Analysis: Use Excel's built-in functions or add-ons to analyze your data and calculate perceptual distances between brands or products based on attribute ratings.
- Visualization: Create a scatter plot in Excel and plot each brand/product based on its position in perceptual space. Use color coding or labeling to differentiate between brands/products or highlight specific areas of interest on the map.
While Excel may not offer the advanced features of dedicated statistical software, it provides a simple and accessible option for conducting perceptual mapping studies, especially for small-scale projects or exploratory analysis.
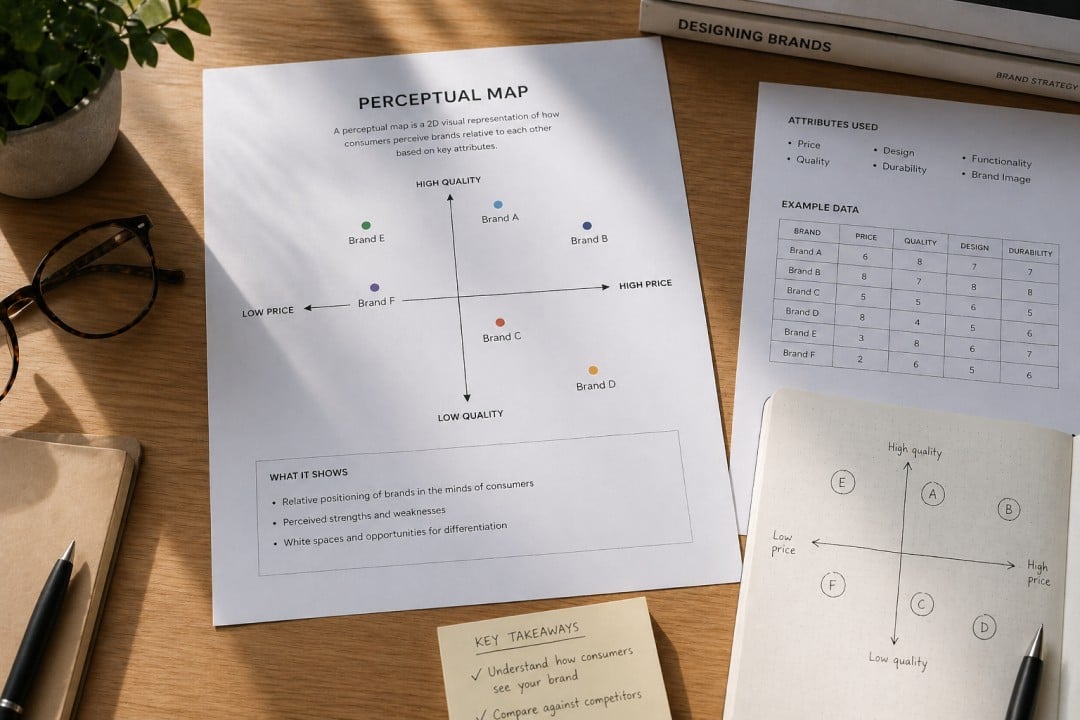
Perceptual Map Template Example
Below is a simplified example of a perceptual map template that you can use to visualize consumer perceptions of brands or products based on two key attributes: price and quality.
 In this example, each dot represents a brand or product, plotted on the map based on its perceived price and quality relative to competitors. Brands/products positioned closer to the "High Quality" axis are perceived as offering higher quality, while those closer to the "Low Price" axis are perceived as more affordable.
By analyzing the perceptual map, you can identify different segments of the market and strategic opportunities for positioning your brand or product. For instance:
- Brands/products in the top-right quadrant are perceived as high quality and high price, targeting consumers who value premium features and are willing to pay a premium price.
- Brands/products in the bottom-right quadrant are perceived as high quality but low price, offering a competitive value proposition to price-sensitive consumers.
- Brands/products in the top-left quadrant are perceived as low quality and high price, indicating potential opportunities for differentiation or improvement in quality perception.
- Brands/products in the bottom-left quadrant are perceived as low quality and low price, targeting budget-conscious consumers.
Using this perceptual map template example as a starting point, you can customize the attributes and dimensions to fit your specific market and industry, helping you gain valuable insights into consumer perceptions and inform strategic decision-making.
Best Practices and Tips for Effective Perceptual Mapping
Perceptual mapping can be a valuable tool for marketers, but it's essential to follow best practices to ensure accurate and actionable results. Here are some tips for conducting effective perceptual mapping:
- Define Clear Objectives: Clearly define the objectives of your perceptual mapping exercise and the scope of your analysis. This will help focus your efforts and ensure that the resulting map provides meaningful insights.
- Select Relevant Attributes: Choose attributes that are meaningful to consumers and relevant to your product category or industry. Avoid including too many attributes, as this can overwhelm the analysis and make interpretation difficult.
- Use Representative Data: Ensure that your data is representative of your target market and collected using reliable methods. Use a mix of quantitative and qualitative data to gain comprehensive insights into consumer perceptions.
- Consider Context: Interpret the results of your perceptual map in the context of broader market trends, competitor actions, and consumer behavior. This will help you make informed decisions and develop effective marketing strategies.
- Validate and Iterate: Validate your perceptual map through additional research or feedback from stakeholders. Iterate on the map as needed to ensure its accuracy and relevance.
- Communicate Clearly: Present your perceptual map in a clear and visually appealing manner, using appropriate labels, symbols, and colors. Clearly communicate the insights gained from the map to stakeholders to drive informed decision-making.
Perceptual Mapping Challenges and Limitations
While perceptual mapping can be a valuable tool for marketers, it's essential to be aware of its limitations and challenges. Here are some common limitations and challenges associated with perceptual mapping:
- Subjectivity: Perceptual mapping relies on consumer perceptions, which can be subjective and influenced by various factors such as personal biases and experiences.
- Simplification of Reality: Perceptual maps provide a simplified representation of consumer perceptions and may not capture the full complexity of the market landscape.
- Data Quality: The accuracy and reliability of perceptual maps depend on the quality of the data used. Poorly collected or biased data can lead to inaccurate results and misleading conclusions.
- Interpretation: Interpreting perceptual maps requires careful consideration of the context and may be subject to interpretation bias.
- Limited Predictive Power: Perceptual maps provide insights into current consumer perceptions but may have limited predictive power for future behavior or market trends.
- Resource Intensive: Conducting perceptual mapping studies can be resource-intensive in terms of time, effort, and cost, particularly for large-scale projects or complex analyses.
Despite these limitations and challenges, perceptual mapping remains a valuable tool for marketers seeking to understand consumer preferences, identify market opportunities, and develop effective marketing strategies. By being aware of these limitations and following best practices, marketers can maximize the value of perceptual mapping in their decision-making processes.
Conclusion for Perceptual Maps
Perceptual mapping is a powerful tool that offers invaluable insights into consumer behavior and market dynamics. By visually representing how consumers perceive brands or products based on specific attributes, perceptual mapping enables marketers to make informed decisions that drive business growth and success. From market segmentation to competitive analysis and product positioning, perceptual mapping empowers businesses to tailor their strategies to meet the needs and preferences of their target audience.
However, it's essential to recognize that perceptual mapping has its limitations and challenges. While it provides valuable insights into current consumer perceptions, it may not accurately predict future behavior or market trends. Additionally, the accuracy and reliability of perceptual maps depend on the quality of the data and the interpretation of results. Despite these challenges, perceptual mapping remains a valuable tool for marketers seeking to understand consumer preferences, identify market opportunities, and develop effective marketing strategies. By following best practices and leveraging the insights gained from perceptual mapping, businesses can stay ahead of the competition and succeed in today's dynamic marketplace.
How to Conduct Perceptual Mapping in Minutes?
Introducing Appinio, your go-to platform for conducting real-time market research with the power of perceptual mapping at your fingertips. As a cutting-edge real-time market research platform, Appinio empowers companies to harness the insights of their target audience swiftly and efficiently, enabling better data-driven decisions. With Appinio, you can conduct your own market research in minutes, revolutionizing the way you make business decisions.
Here's why Appinio stands out:
- From questions to insights in minutes: With Appinio's intuitive platform, you can gather valuable consumer insights swiftly, allowing you to make informed decisions without delay.
- No need for a PhD in research: Appinio's user-friendly interface makes market research accessible to everyone, regardless of their level of expertise, empowering anyone to conduct professional-quality research effortlessly.
- Define the right target group, anywhere: With access to over 1,200 characteristics and the ability to survey respondents in over 90 countries, Appinio enables you to pinpoint your target audience with precision and reach them wherever they are.