Appinio Research · 16.04.2026 · 27min read

Have you ever wondered how researchers and analysts make sense of complex data to uncover hidden relationships and patterns? Enter cross tabulation, a powerful statistical technique that allows us to explore the connections between different categories of data. In simple terms, cross tabulation helps us understand how one categorical variable relates to another by organizing data into a table format.
Whether it's understanding consumer preferences in market research, analyzing social trends in the social sciences, or optimizing business operations, cross tabulation serves as a fundamental tool in data analysis. By breaking down data into manageable chunks and examining how categories intersect, cross tabulation enables us to draw insights, make informed decisions, and drive positive outcomes across various domains.
What is Cross Tabulation?
Cross tabulation, also known as contingency table analysis or crosstabs, is a statistical method used to analyze the relationship between two or more categorical variables. It involves tabulating the frequencies or counts of observations that fall into various categories for each variable and then examining how these categories intersect. The primary purpose of cross tabulation is to uncover patterns, associations, and dependencies between categorical variables in a dataset.
Importance of Cross Tabulation in Data Analysis
Cross tabulation plays a crucial role in data analysis across various domains due to its versatility and effectiveness in exploring relationships between categorical variables. Some key reasons why cross-tabulation is important in data analysis include:
- Identifying Patterns: Cross tabulation helps identify patterns, trends, and associations between categorical variables that may not be evident from examining individual variables in isolation.
- Exploring Relationships: By examining the relationships between categorical variables, cross tabulation allows analysts to investigate potential associations and dependencies, guiding further investigation and hypothesis testing.
- Summarizing Data: Cross tabulation provides a concise summary of the distribution of observations across different categories of variables, making it easier to interpret and communicate findings to stakeholders.
- Informing Decision-Making: Insights derived from cross-tabulation analyses can inform decision-making processes in various domains, including marketing, social sciences, healthcare, and business operations.
Cross-Tabulation Analysis Concepts
To understand cross-tabulation, it's essential to grasp some fundamental concepts:
- Categorical Variables: In cross tabulation, variables are categorized as either independent or dependent variables, each with distinct categories or levels. These variables represent qualitative characteristics, such as gender, age group, product type, or geographic region.
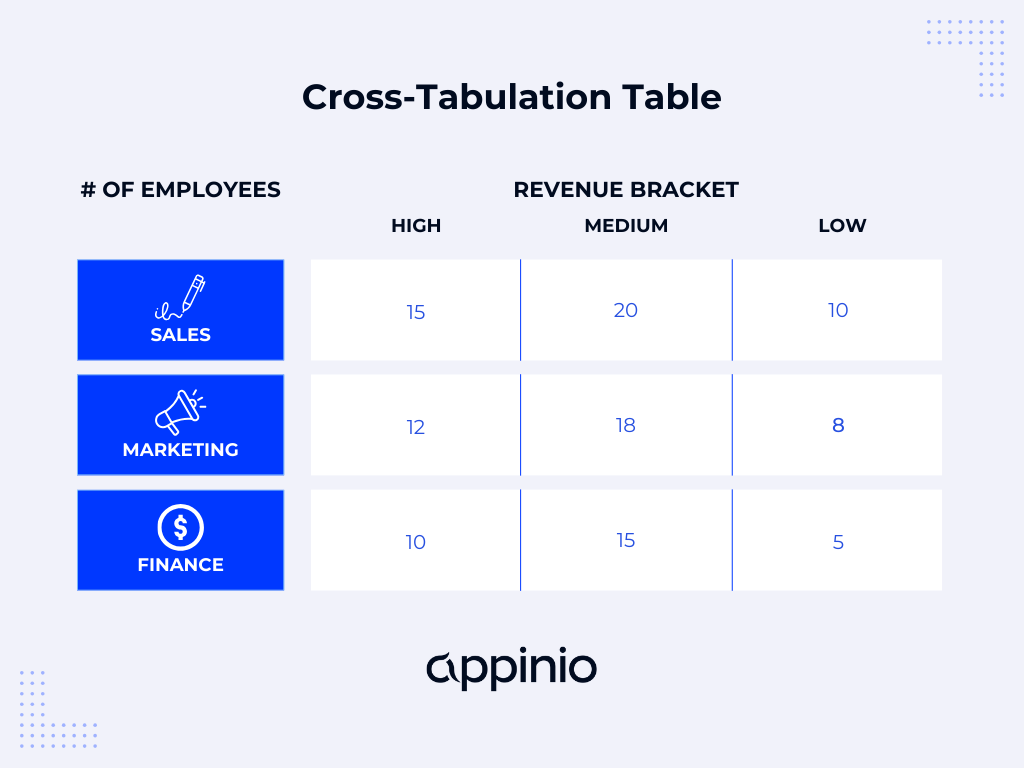
- Contingency Table: Also known as a cross-tabulation table, a contingency table organizes data into rows and columns, with each cell representing the count or frequency of observations belonging to specific combinations of categories for the variables being analyzed.
- Marginal Totals: Marginal totals refer to the sums of counts or frequencies across rows and columns of a contingency table, representing the total number of observations for each category of the variables.
- Conditional Frequencies: Conditional frequencies, also known as cell percentages or proportions, are calculated by dividing the frequency in each contingency table cell by the corresponding marginal total. Conditional frequencies express the proportion of observations in each cell relative to the total number of observations for that row or column.
Understanding these basic concepts is essential for conducting meaningful cross-tabulation analyses and interpreting the results accurately.
Understanding Data for Cross-Tabulation
Before diving into the process of cross tabulation, it's crucial to understand the types of data suitable for this analytical technique and how to prepare your data effectively.
Types of Data Suitable for Cross Tabulation
Cross tabulation is most commonly used with categorical data, where variables fall into distinct categories or groups. Categorical data can be further classified into two main types:
- Nominal Data: Nominal data consists of categories with no inherent order or ranking. Examples include gender (male, female), ethnicity (Asian, African American, Hispanic), and marital status (single, married, divorced).
- Ordinal Data: On the other hand, Ordinal data represents categories with a natural order or ranking. Examples include education level (high school, bachelor's degree, master's degree) and income bracket (low, medium, high).
Cross tabulation is particularly well-suited for analyzing relationships between categorical variables, making it an invaluable tool in various fields such as market research, social sciences, and business analytics.
Data Preparation and Cleaning
Before conducting cross tabulation, it's essential to ensure that your data is clean, accurate, and properly formatted. Data preparation and cleaning involves:
- Removing Duplicates: Check for and remove any duplicate observations in your dataset to prevent inflated counts or biased results.
- Handling Missing Values: Decide how to handle missing values in your data. Depending on the extent of missingness, you may choose to exclude observations with missing values or use imputation techniques to fill in the gaps.
- Standardizing Variables: Standardize categorical variables to ensure consistency and comparability across categories. For example, if you're analyzing data on customer satisfaction ratings, ensure that all responses are coded consistently (e.g., on a scale of 1 to 5).
- Checking Data Integrity: Verify the integrity of your data by conducting checks for outliers, inconsistencies, or errors. This may involve visual inspections, summary statistics, or data validation checks.
In streamlining your data preparation process for cross-tabulation analysis, leveraging Appinio can significantly enhance efficiency. Appinio's automated data collection and cleaning features simplify the tedious tasks of removing duplicates, handling missing values, and standardizing variables. By automating these processes, Appinio frees up valuable time for researchers and analysts to focus on deriving insights and making informed decisions from their cross-tabulation analyses.
Ready to experience seamless data preparation for your cross-tabulation projects? Book a demo today!
Identifying Variables for Analysis
Choosing the proper variables for cross tabulation is critical to obtaining meaningful insights from your data. Consider the research questions or hypotheses you're investigating and select variables relevant to your analysis objectives.
- Relevance: Ensure the variables you select are relevant to the research question or problem you're addressing. Focus on variables that are likely to exhibit meaningful relationships or associations.
- Independence: Aim to select variables that are independent of each other to avoid multicollinearity issues. If variables are highly correlated, consider excluding one of them from the analysis or exploring interactions between variables.
- Data Availability: Check the availability and completeness of data for the variables you intend to analyze. Ensure you have an adequate sample size for each category within the variables to obtain reliable results.
By carefully selecting and preparing your data for cross tabulation, you can ensure that your analysis yields accurate and actionable insights into the relationships between categorical variables.
How to Perform Cross Tabulation?
Now, let's delve into the step-by-step process of conducting cross tabulation. From selecting the appropriate software or tools to interpreting the results of your analysis.
1. Select Your Software or Tools
Choosing the right software or tools for cross tabulation depends on your specific needs, preferences, and level of expertise. Here are some commonly used options:
- Excel: Excel is a versatile tool that offers basic cross-tabulation functionality through its pivot table feature. It's user-friendly and widely accessible, making it suitable for beginners and small-scale analyses. It also allows for the use of custom and pre-built spreadsheet templates to help you get started right away.
- Statistical Software: More advanced statistical software packages such as SPSS, SAS, and R offer robust capabilities for cross tabulation and other types of statistical analysis. These tools provide greater flexibility, customization options, and advanced statistical tests for exploring relationships between variables.
- Programming Languages: For experienced analysts and those seeking maximum flexibility and control, programming languages like R and Python with libraries such as Pandas and NumPy are excellent choices. These languages allow for customized cross tabulation and integration with other analytical techniques and visualizations.
When selecting software or tools for cross-tabulation, consider factors such as ease of use, compatibility with your data format, and the specific features and functionality you require.
2. Import Your Data
Once you've chosen your preferred software or tool, the next step is to import your data into the platform. Depending on the software you're using and the format of your data, this may involve:
- Uploading Files: Importing data files from sources such as Excel spreadsheets, CSV files, or databases directly into the software.
- Connecting to Data Sources: Establishing connections to external data sources such as databases, data warehouses, or online repositories to access the relevant data.
- Data Preparation: Preparing your data for analysis by ensuring it's properly formatted, cleaned, and organized. This may involve transforming variables, standardizing formats, and addressing missing values or outliers.
With Appinio, automating the collection of data needed for cross tabulation becomes seamless and efficient. Appinio's intuitive platform simplifies the process of gathering diverse datasets from targeted audiences, ensuring that you have the data you need for your analysis. By leveraging Appinio's automated features, you can focus on exploring relationships between variables and deriving actionable insights, rather than spending time on manual data collection tasks.
Ready to streamline your data-gathering process and unlock valuable insights? Book a demo today!
3. Create a Cross-Tabulation Table
 With your data imported, you can now create cross-tabulation tables to explore relationships between categorical variables. The process typically involves:
- Selecting Variables: Choose the variables you want to analyze and cross-tabulate. These variables should be categorical in nature and relevant to your research question or analysis objectives.
- Defining Categories: Define the categories or groups within each variable you want to compare. This may involve specifying subgroups, ranges, or classifications based on the unique characteristics of your data.
- Generating Tables: Use the software or tool's cross tabulation function to create tables that display the frequencies or counts of observations for each combination of categories. Depending on the software, you may have options to customize the table layout, format, and summary statistics.
4. Interpret Results
Once you've created the cross-tabulation tables, it's time to interpret the results and extract meaningful insights from your analysis.
- Examining Patterns: Review the cross tabulation tables to identify any patterns, trends, or relationships between the variables. Look for differences or variations in frequencies across categories that may indicate associations or dependencies.
- Assessing Significance: Determine whether the observed relationships are statistically significant. Depending on the software or tools used, you may conduct statistical tests such as chi-square tests or Fisher's exact tests to assess the significance of the associations.
- Drawing Conclusions: Based on your analysis, draw conclusions about the relationships between variables and their implications for your research question or problem. Consider how the findings align with existing theories, hypotheses, or practical implications in your field of study.
By following these steps, you can effectively perform cross tabulation analysis and gain valuable insights into the relationships between categorical variables in your dataset.
Cross Tabulation Applications
Cross tabulation finds widespread applications across various fields due to its versatility and effectiveness in analyzing relationships between categorical variables. Let's explore some common areas where cross-tabulation is extensively used.
Market Research
Cross-tabulation plays a pivotal role in understanding consumer behavior, preferences, and market trends in market research. By cross-tabulating demographic variables such as age, gender, income, and geographic location with product preferences, purchasing habits, and brand loyalty, market researchers can gain insights into target markets, segmentations, and consumer profiles. This information aids businesses in tailoring their marketing strategies, product offerings, and promotional campaigns to effectively target specific consumer segments and maximize profitability.
Social Science Studies
Social scientists leverage cross tabulation to analyze survey data and explore relationships between various socio-demographic factors, attitudes, beliefs, and behaviors. Whether studying political affiliations, voting patterns, educational attainment, or health outcomes, cross tabulation allows researchers to uncover correlations, trends, and disparities within populations. By examining cross tabulation tables, social scientists can identify patterns of inequality, cultural differences, and social dynamics, contributing to a deeper understanding of human behavior and societal trends.
Business Analytics
In business analytics, cross tabulation is a powerful tool for analyzing customer data, sales performance, and operational metrics. Businesses use cross tabulation to segment customers based on demographic attributes, purchasing behaviors, and transaction histories, enabling targeted marketing campaigns, personalized customer experiences, and customer retention strategies.
Cross-tabulation is also employed in analyzing sales data to identify product performance, market trends, and sales channels' effectiveness, guiding inventory management, pricing strategies, and sales forecasting efforts. Additionally, cross-tabulation aids businesses in evaluating operational processes, identifying bottlenecks, and implementing quality improvement initiatives to enhance efficiency and productivity.
Quality Control and Process Improvement
Cross tabulation is instrumental in quality control and process improvement initiatives across industries such as manufacturing, healthcare, and service sectors. By cross-tabulating defect types with production lines, time periods, or process stages, organizations can pinpoint areas of inefficiency, root causes of defects, and opportunities for optimization. This enables proactive quality management, continuous process monitoring, and corrective actions to enhance product quality, reduce waste, and streamline operations.
Moreover, cross tabulation facilitates performance analysis in healthcare settings by correlating patient outcomes with treatment methods, healthcare providers, and demographic factors, supporting evidence-based decision-making, clinical interventions, and healthcare delivery optimization efforts.
By recognizing these diverse applications of cross tabulation, professionals across various domains can harness their analytical power to derive actionable insights, make informed decisions, and drive organizational success.
Cross Tabulation Examples
In business, cross-tabulation finds diverse applications beyond the commonly discussed areas. Let's explore real-life examples of businesses leveraging cross-tabulation to gain insights, optimize operations, and drive growth.
Customer Segmentation and Personalization
Imagine a retail chain seeking to enhance its marketing efforts and customer experience. By employing cross tabulation, the company can analyze customer data from various sources, including demographics, purchase history, and behavioral patterns.
Through cross tabulation, the company segments its customer base into distinct groups based on factors such as age, income, and purchasing preferences. Armed with these insights, the retail chain can tailor its marketing campaigns, product offerings, and promotions to specific customer segments, thereby improving engagement, loyalty, and sales.
Employee Performance and Training Evaluation
Cross-tabulation in a corporate setting is invaluable in assessing employee performance and identifying training needs. A multinational corporation, for instance, conducts regular performance evaluations across its workforce, considering factors such as department, tenure, and job role.
By cross-tabulating performance ratings with demographic and employment-related variables, the company gains a holistic view of employee performance trends and identifies areas for improvement. This analysis informs targeted training programs and professional development initiatives, enhancing employee skills, productivity, and retention.
Customer Feedback and Product Development
Gathering and analyzing customer feedback is critical for refining features and functionalities for a tech startup launching a new software product. By cross-tabulating customer survey responses, the startup categorizes feedback based on user demographics, usage frequency, and satisfaction levels.
The startup identifies key insights regarding user preferences, pain points, and feature priorities by examining the intersections between different feedback categories. This analysis guides product development decisions, enabling the startup to iterate quickly, address customer needs effectively, and deliver a more user-centric product.
Supply Chain Optimization and Vendor Management
In supply chain management, cross-tabulation aids businesses in optimizing inventory levels, streamlining procurement processes, and managing vendor relationships. A manufacturing company, for example, cross-tabulates inventory data with supplier performance metrics, such as delivery times, product quality, and pricing.
By analyzing the relationship between inventory levels and supplier performance across different product categories or geographic regions, the company identifies opportunities to rationalize its supplier base, negotiate favorable terms, and mitigate supply chain risks. This strategic approach to vendor management enhances operational efficiency, reduces costs, and ensures continuity of supply.
By leveraging cross tabulation in these diverse business scenarios, organizations can gain actionable insights, make data-driven decisions, and drive strategic initiatives that lead to competitive advantage and sustainable growth.
Advanced Techniques and Tips for Cross Tabulation
As you become more proficient in cross tabulation analysis, you can employ several advanced techniques and strategies to enhance the accuracy, efficiency, and depth of your analyses.
Handling Missing Data
Dealing with missing data is a common challenge in data analysis, including cross tabulation. To address this issue effectively, consider the following techniques:
- Imputation: Impute missing values using statistical methods such as mean imputation, median imputation, or predictive modeling based on available data. Imputation helps preserve sample size and maintain statistical power but may introduce bias if not done carefully.
- Multiple Imputation: Perform multiple imputations by generating multiple plausible values for missing data based on observed values and their uncertainty. Pooling results from multiple imputed datasets yields more accurate estimates and valid inferences.
- Sensitivity Analysis: Conduct sensitivity analysis to assess the robustness of your results to different imputation methods or assumptions about missing data mechanisms. Sensitivity analysis helps identify potential biases and uncertainties in your findings.
Dealing with Large Datasets
Analyzing large datasets presents unique challenges in terms of computational efficiency and scalability. To handle large datasets effectively in cross-tabulation analysis:
- Sampling: Utilize random or stratified sampling techniques to select a representative subset of the data for analysis and avoid sampling bias. Sampling reduces computational burden and speeds up analysis without sacrificing statistical validity if done properly.
- Parallel Processing: Take advantage of parallel processing capabilities in software or programming languages to distribute computations across multiple processors or nodes. Parallel processing accelerates analysis and allows for efficient utilization of computational resources.
- Data Reduction Techniques: Apply data reduction techniques such as principal component analysis (PCA) or factor analysis to reduce the dimensionality of the dataset while preserving essential information. Data reduction simplifies analysis and improves interpretability without sacrificing accuracy.
Incorporating Statistical Tests
To assess the significance of relationships between variables in cross tabulation analysis, consider incorporating statistical tests to quantify the strength and significance of associations. Commonly used statistical tests include:
- Chi-Square Test: Assess the independence of two categorical variables by comparing observed frequencies with expected frequencies under the null hypothesis of independence. The chi-square test provides a measure of association and determines whether observed differences are statistically significant.
- Fisher's Exact Test: When dealing with small sample sizes or sparse data, Fisher's exact test provides a more accurate assessment of independence between variables compared to the chi-square test. It calculates the precise probability of observing the data under the null hypothesis of independence.
- Cramer's V: Compute Cramer's V statistic as a measure of effect size for the association between categorical variables. Cramer's V ranges from 0 to 1, with higher values indicating stronger associations.
Visualizing Cross-Tabulation Results
Visualizing cross tabulation results enhances understanding, interpretation, and communication of findings. Common visualization techniques include:
- Bar Charts: Create bar charts to visually compare frequencies or proportions of different categories within each variable. Bar charts are effective for displaying categorical data and identifying patterns or trends.
- Stacked Bar Charts: Use stacked bar charts to illustrate the distribution of one variable across categories of another variable. Stacked bar charts help visualize conditional proportions and highlight differences between groups.
- Heatmaps: Generate heatmaps to visualize the cross tabulation table as a color-coded matrix, with cell shading representing the frequency or proportion of observations in each cell. Heatmaps facilitate pattern recognition and reveal underlying structures in the data.
By incorporating these advanced techniques and tips into your cross tabulation analyses, you can overcome challenges, improve the quality of your results, and derive deeper insights from your data.
Cross Tabulation Challenges
Cross tabulation, while a valuable analytical technique, comes with its own set of challenges and limitations. Understanding these challenges is crucial for ensuring the accuracy and reliability of your analysis. Common challenges and constraints of cross-tabulation include:
- Small Sample Sizes: Cross tabulation may yield unreliable results when applied to datasets with small sample sizes or sparse data. Small sample sizes can lead to inflated estimates of association or result in statistical tests with low power.
- Assumption of Independence: Cross tabulation assumes independence between categorical variables, which may not always hold true in real-world scenarios. Failing to account for confounding variables or omitted variables can bias results and lead to erroneous conclusions.
- Limited to Categorical Data: Cross tabulation is primarily suited for analyzing relationships between categorical variables and may not be applicable to continuous or ordinal data. Continuous variables may need to be discretized or categorized to facilitate cross tabulation, potentially losing information in the process.
- Interpretation Complexity: Interpreting cross tabulation results can be complex, particularly when dealing with multiple variables or interactions between variables. Understanding the nuances of association measures, effect sizes, and statistical tests is essential for accurate interpretation.
- Data Quality Issues: Cross tabulation results are only as reliable as the quality of the underlying data. Data quality issues such as missing values, measurement error, or response bias can compromise the validity and generalizability of findings.
Cross Tabulation Best Practices
To maximize the effectiveness and reliability of your cross-tabulation analyses, consider implementing the following best practices:
- Clearly Define Research Objectives: Before conducting cross tabulation, clearly define your research objectives, hypotheses, and analytical goals. Understanding the purpose of your analysis helps guide variable selection, interpretation of results, and decision-making.
- Choose Appropriate Variables: Select variables for cross tabulation that are relevant to your research question and meaningful in the context of your analysis. Consider both independent and dependent variables that may influence the relationship of interest.
- Use Statistical Tests Wisely: When appropriate, incorporate statistical tests such as chi-square tests or Fisher's exact tests to assess the significance of associations between categorical variables. Choose tests that are suitable for your data characteristics and research design.
- Interpret Results Cautiously: Exercise caution when interpreting cross tabulation results, considering potential confounding variables, alternative explanations, and limitations of the analysis. Avoid making causal inferences based solely on association measures.
- Visualize Results Effectively: Utilize visualizations such as bar charts, stacked bar charts, or heatmaps to present cross tabulation results in a clear and concise manner. Visualizations aid in identifying patterns, trends, and outliers in the data.
By adhering to these best practices, you can ensure that your cross-tabulation analyses are conducted rigorously, interpreted accurately, and yield meaningful insights for decision-making and further research.
Conclusion for Cross-Tabulation Analysis
Cross tabulation is a valuable tool for anyone seeking to gain insights from categorical data. By organizing data into tables and examining how different categories intersect, cross tabulation helps us uncover patterns, trends, and relationships that may not be immediately apparent. Whether you're a researcher, analyst, or business professional, mastering the techniques of cross tabulation can enhance your ability to make data-driven decisions and solve complex problems.
In the ever-expanding data analysis landscape, cross tabulation remains a cornerstone technique for exploring relationships between categorical variables. Its simplicity and effectiveness make it accessible to beginners while offering advanced capabilities for experienced analysts. By understanding the basics of cross tabulation, considering its applications and limitations, and following best practices, you can harness its power to extract meaningful insights and drive positive outcomes in your endeavors.
How to Easily Collect Data for Cross-Tabulation Analysis?
Introducing Appinio, the real-time market research platform revolutionizing how companies gather consumer insights. With Appinio, conducting cross tabulation analysis has never been easier. Here's why you should choose Appinio:
- From questions to insights in minutes: With Appinio's streamlined process, you can collect data and conduct cross-tabulation analysis in a fraction of the time it takes with traditional methods.
- No expertise required: Our platform is so intuitive that anyone can use it, no PhD in research needed. Say goodbye to complex research tools and hello to effortless data collection.
- Worldwide reach: Define your target group from over 1200 characteristics and survey consumers in over 90 countries. With access to a diverse pool of respondents, you can ensure your cross tabulation analysis reflects global perspectives.

